6 tidyverse
library(ggplot2)- factors aims to handle categorical variables, i.e.,
factorclass in R.
6.1 forcats::fct_reorder(f, x)
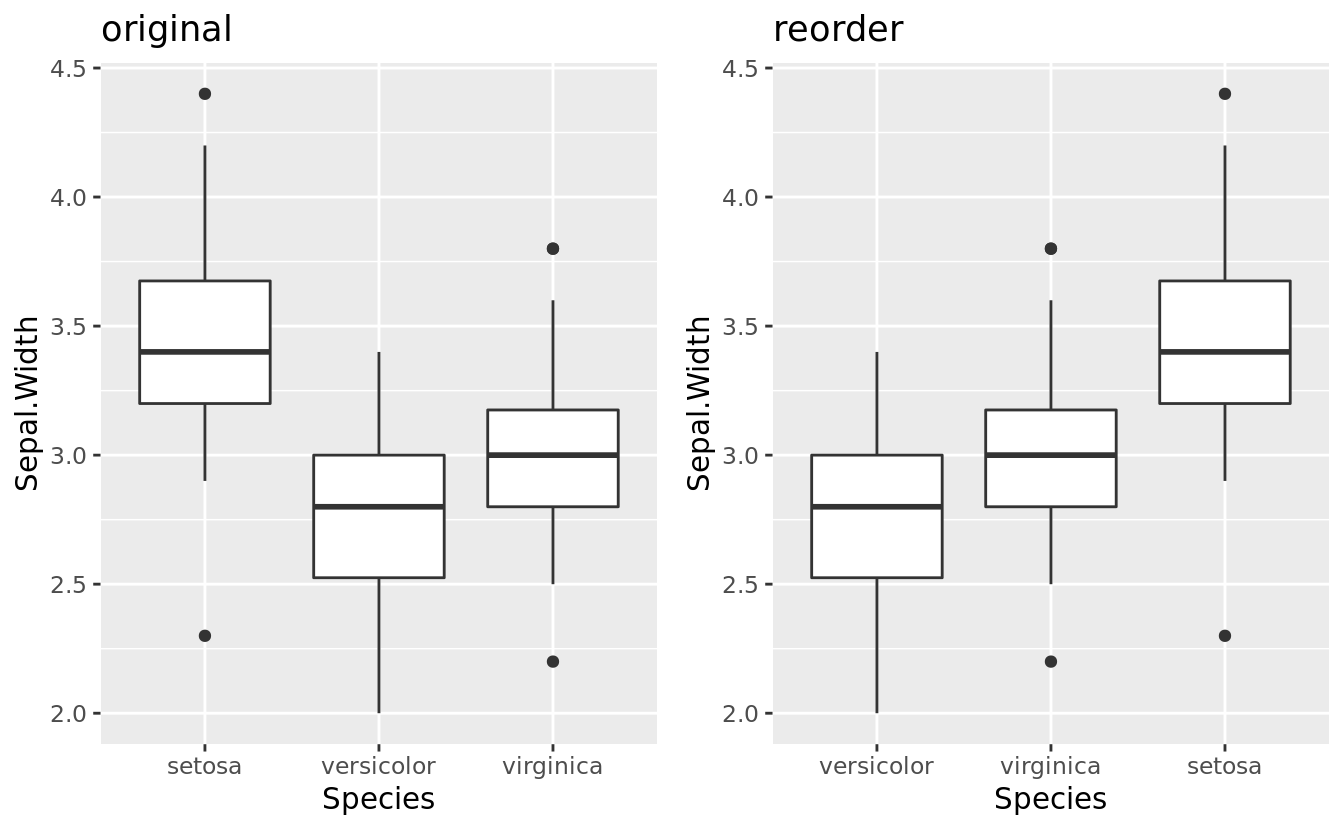
each level is associated with a x value (if multiple, use a function such as median() to generate a single value), the order is determined by sorting the corresponding x value.
with(iris, forcats::fct_reorder(Species, Sepal.Width)) %>% levels
#> [1] "versicolor" "virginica"  "setosa"

iris %>% dplyr::group_by(Species) %>%
   dplyr::summarise(Sepal.Width = median(Sepal.Width)) %>%
   dplyr::arrange(Sepal.Width) %>% .$Species %>% as.character()
#> `summarise()` ungrouping output (override with `.groups` argument)
#> [1] "versicolor" "virginica"  "setosa"
As you can see in following plot, Species has been reordered by median of Sepal.Width.
cowplot::plot_grid(
    iris %>%
        ggplot(aes(Species, Sepal.Width)) + geom_boxplot() +
        labs(title = 'original'),
    iris %>% dplyr::mutate_at("Species", ~forcats::fct_reorder(., Sepal.Width)) %>%
        ggplot(aes(Species, Sepal.Width)) + geom_boxplot() +
        labs(title = 'reorder')
)
forcats::fct_reorder()
6.2 forcats::fct_reorder2(f, x, y)
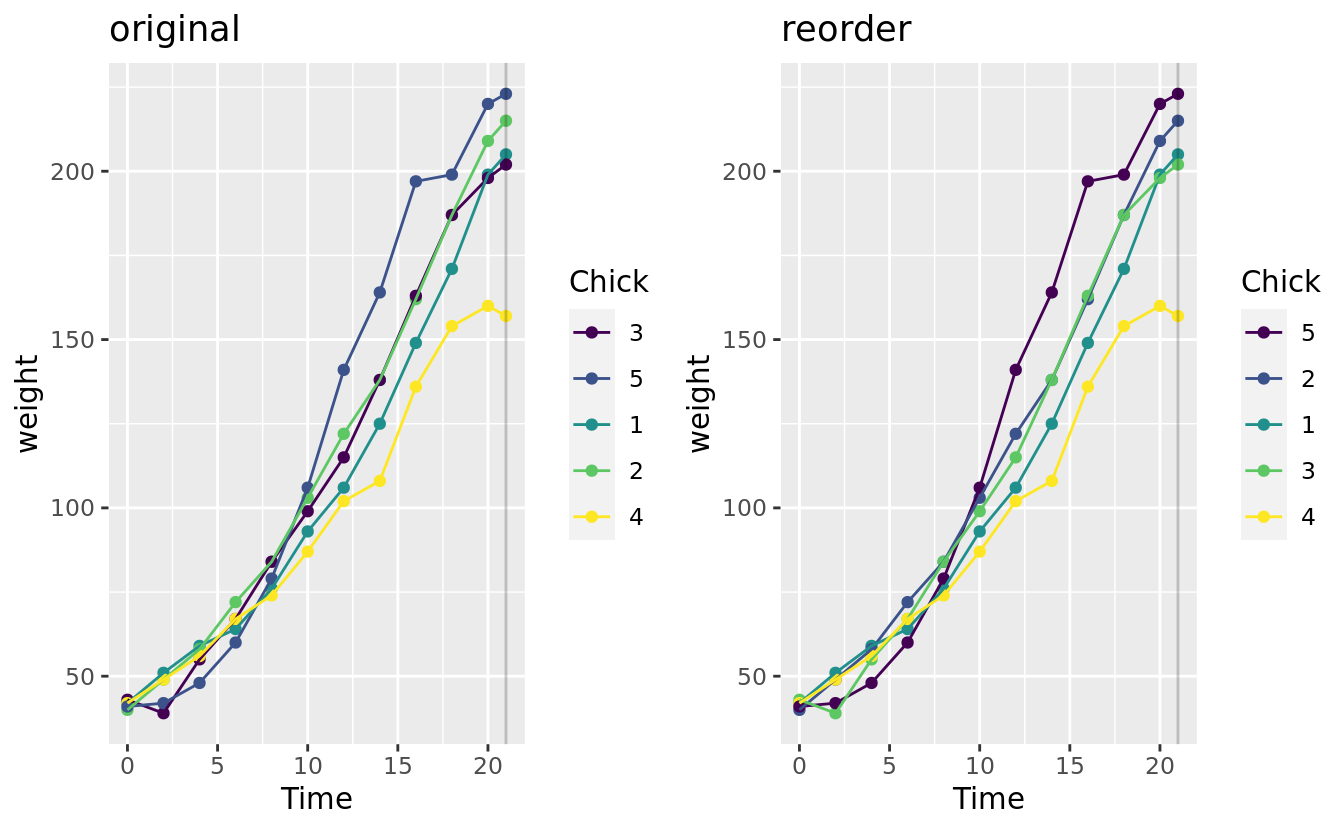
Each level is associated with many x values and many y values, we use a function such as max() to select a x value, then we can get the corresponding y value. Now each level is associated with a single y value, and we can determine the order by sorting those y values. [^fct-reorder2-plot]
set.seed(0)
chkw <- ChickWeight %>% head(60) %>% dplyr::mutate_at('Chick', forcats::fct_shuffle)

with(chkw, forcats::fct_reorder2(Chick, Time, weight)) %>% levels()
#>  [1] "5"  "2"  "1"  "3"  "4"  "13" "34" "18" "31" "22" "43" "48" "36" "24" "35"
#> [16] "19" "10" "17" "50" "27" "41" "9"  "33" "16" "40" "44" "6"  "39" "46" "7"
#> [31] "15" "20" "25" "47" "49" "26" "42" "28" "12" "14" "38" "32" "45" "23" "37"
#> [46] "8"  "29" "30" "11" "21"

chkw %>% dplyr::group_by(Chick) %>% dplyr::arrange(dplyr::desc(Time)) %>%
   dplyr::slice(1) %>% dplyr::ungroup() %>%
   dplyr::arrange(dplyr::desc(weight)) %>% .$Chick %>% as.character()
#> [1] "5" "2" "1" "3" "4"
As you can see in following plot, the vertical line (max Time), Chick has been reordered by weight at that line.
cowplot::plot_grid(
    chkw %>%
        ggplot(aes(Time, weight, colour = Chick)) + geom_point() + geom_line() +
        geom_vline(xintercept = 21, alpha = 0.2) + labs(title = 'original'),
    chkw %>% dplyr::mutate_at("Chick", ~forcats::fct_reorder2(., Time, weight)) %>%
        ggplot(aes(Time, weight, colour = Chick)) + geom_point() + geom_line() +
        geom_vline(xintercept = 21, alpha = 0.2) + labs(title = 'reorder')
)
forcats::fct_reorder2()