19.1 Getting started
You can turn any HTML-oriented R Markdown documents to Shiny documents by adding runtime: shiny to the YAML metadata as a top-level field, e.g.,
---
title: "Shiny Document"
output: html_document
runtime: shiny
---
Note that the output format of the R Markdown document must be an HTML format. That is, the document should generate a web page (a *.html file). Non-HTML formats such as pdf_document and word_document will not work with the Shiny runtime. Please also note that some presentation formats are also HTML formats, such as ioslides_presentation and slidy_presentation.
You can also create a new Shiny document from the RStudio menu File -> New File -> R Markdown, and choose the document type “Shiny” (see Figure 19.1).
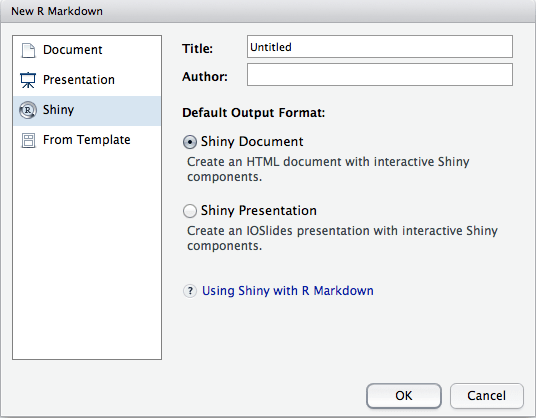
FIGURE 19.1: Create a new Shiny document in RStudio.
To run a Shiny document in RStudio, you need to click the button “Run Document” on the editor toolbar (RStudio will automatically replace the “Knit” button with “Run Document” when it detects a Shiny document). If you do not use RStudio, or want to run the document in the R console for troubleshooting, you can call the function rmarkdown::run() and pass the filename to it.
You can embed Shiny inputs and outputs in your document. Outputs are automatically updated whenever inputs change. In the following example, we create a numeric input (numericInput) with the name rows, and then refer to its value via input$rows when generating output:
```{r, echo=FALSE}
numericInput("rows", "How many cars?", 5)

renderTable({
  head(cars, input$rows)
})
```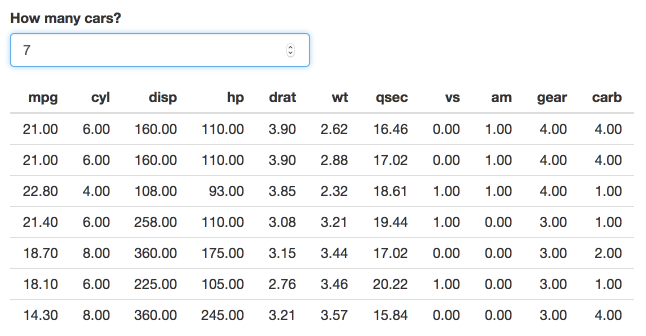
FIGURE 19.2: Increase the number of rows in the table in a Shiny document.
In the above example, the output code was wrapped in a call to renderTable(). There are many other render functions in Shiny that can be used for plots, printed R output, and more. This example uses renderPlot() to create dynamic plot output:
```{r, echo=FALSE}
sliderInput("bins", "Number of bins:", 30, min = 1, max = 50)

renderPlot({
  x    = faithful[, 2]  # Old Faithful Geyser data
  bins = seq(min(x), max(x), length.out = input$bins + 1)

  # draw the histogram with the specified number of bins
  hist(x, breaks = bins, col = 'darkgray', border = 'white')
})
```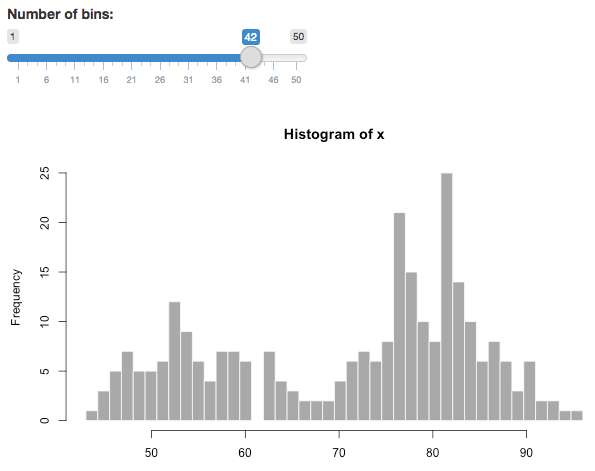
FIGURE 19.3: Change the number of bins of a histogram in a Shiny document.