22.3 Locating errors
Once you’ve made the error repeatable, the next step is to figure out where it comes from. The most important tool for this part of the process is traceback(), which shows you the sequence of calls (also known as the call stack, Section 7.5) that lead to the error.
Here’s a simple example: you can see that f() calls g() calls h() calls i(), which checks if its argument is numeric:
f <- function(a) g(a)
g <- function(b) h(b)
h <- function(c) i(c)
i <- function(d) {
  if (!is.numeric(d)) {
    stop("`d` must be numeric", call. = FALSE)
  }
  d + 10
}
When we run f("a") code in RStudio we see:
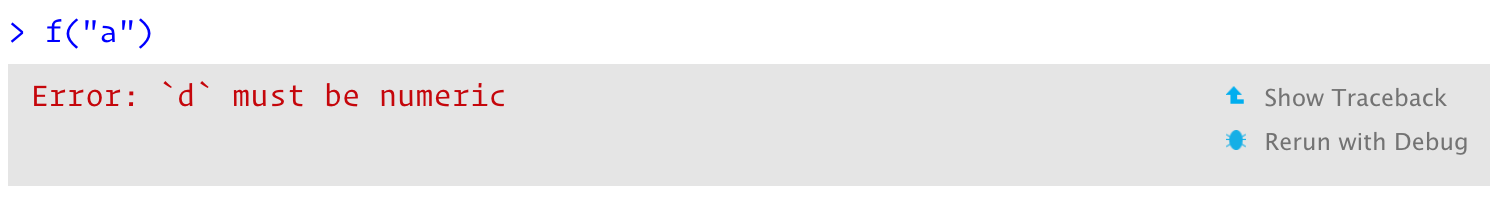
Two options appear to the right of the error message: “Show Traceback” and “Rerun with Debug”. If you click “Show traceback” you see:
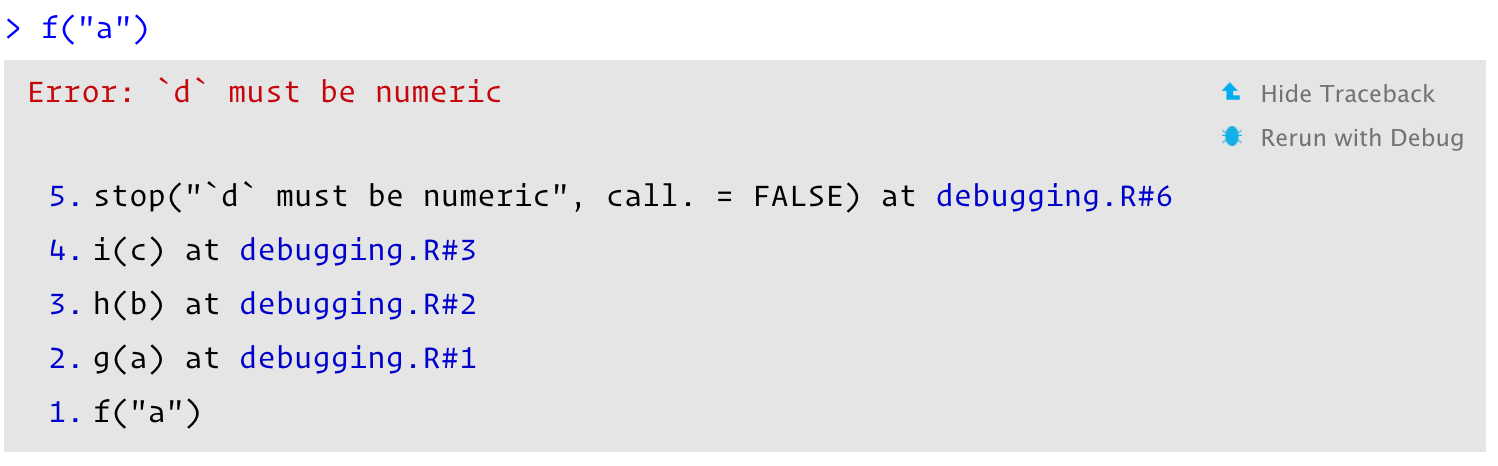
If you’re not using RStudio, you can use traceback() to get the same information (sans pretty formatting):
traceback()
#> 5: stop("`d` must be numeric", call. = FALSE) at debugging.R#6
#> 4: i(c) at debugging.R#3
#> 3: h(b) at debugging.R#2
#> 2: g(a) at debugging.R#1
#> 1: f("a")
NB: You read the traceback() output from bottom to top: the initial call is f(), which calls g(), then h(), then i(), which triggers the error. If you’re calling code that you source()d into R, the traceback will also display the location of the function, in the form filename.r#linenumber. These are clickable in RStudio, and will take you to the corresponding line of code in the editor.
22.3.1 Lazy evaluation
One drawback to traceback() is that it always linearises the call tree, which can be confusing if there is much lazy evaluation involved (Section 7.5.2). For example, take the following example where the error happens when evaluating the first argument to f():
j <- function() k()
k <- function() stop("Oops!", call. = FALSE)
f(j())
#> Error: Oops!traceback()
#> 7: stop("Oops!") at #1
#> 6: k() at #1
#> 5: j() at debugging.R#1
#> 4: i(c) at debugging.R#3
#> 3: h(b) at debugging.R#2
#> 2: g(a) at debugging.R#1
#> 1: f(j())You can using rlang::with_abort() and rlang::last_trace() to see the call tree. Here, I think it makes it much easier to see the source of the problem. Look at the last branch of the call tree to see that the error comes from j() calling k().
rlang::with_abort(f(j()))
#> Error: Oops!
rlang::last_trace()
#> Error: Can't show last error because no error was recorded yet
NB: rlang::last_trace() is ordered in the opposite way to traceback(). We’ll come back to that issue in Section 22.4.2.4.