8.2 Arranging plots on top of each other
While a lot of the functionality in patchwork is concerned with aligning plots in a grid, it also allows you to make insets, i.e. small plots placed on top of another plot. The functionality for this is wrapped in the inset_element() function which serves to mark the given plot as an inset to be placed on the preceding plot, along with recording the wanted placement etc. The basic usage is like this:
p1 + inset_element(p2, left = 0.5, bottom = 0.4, right = 0.9, top = 0.95)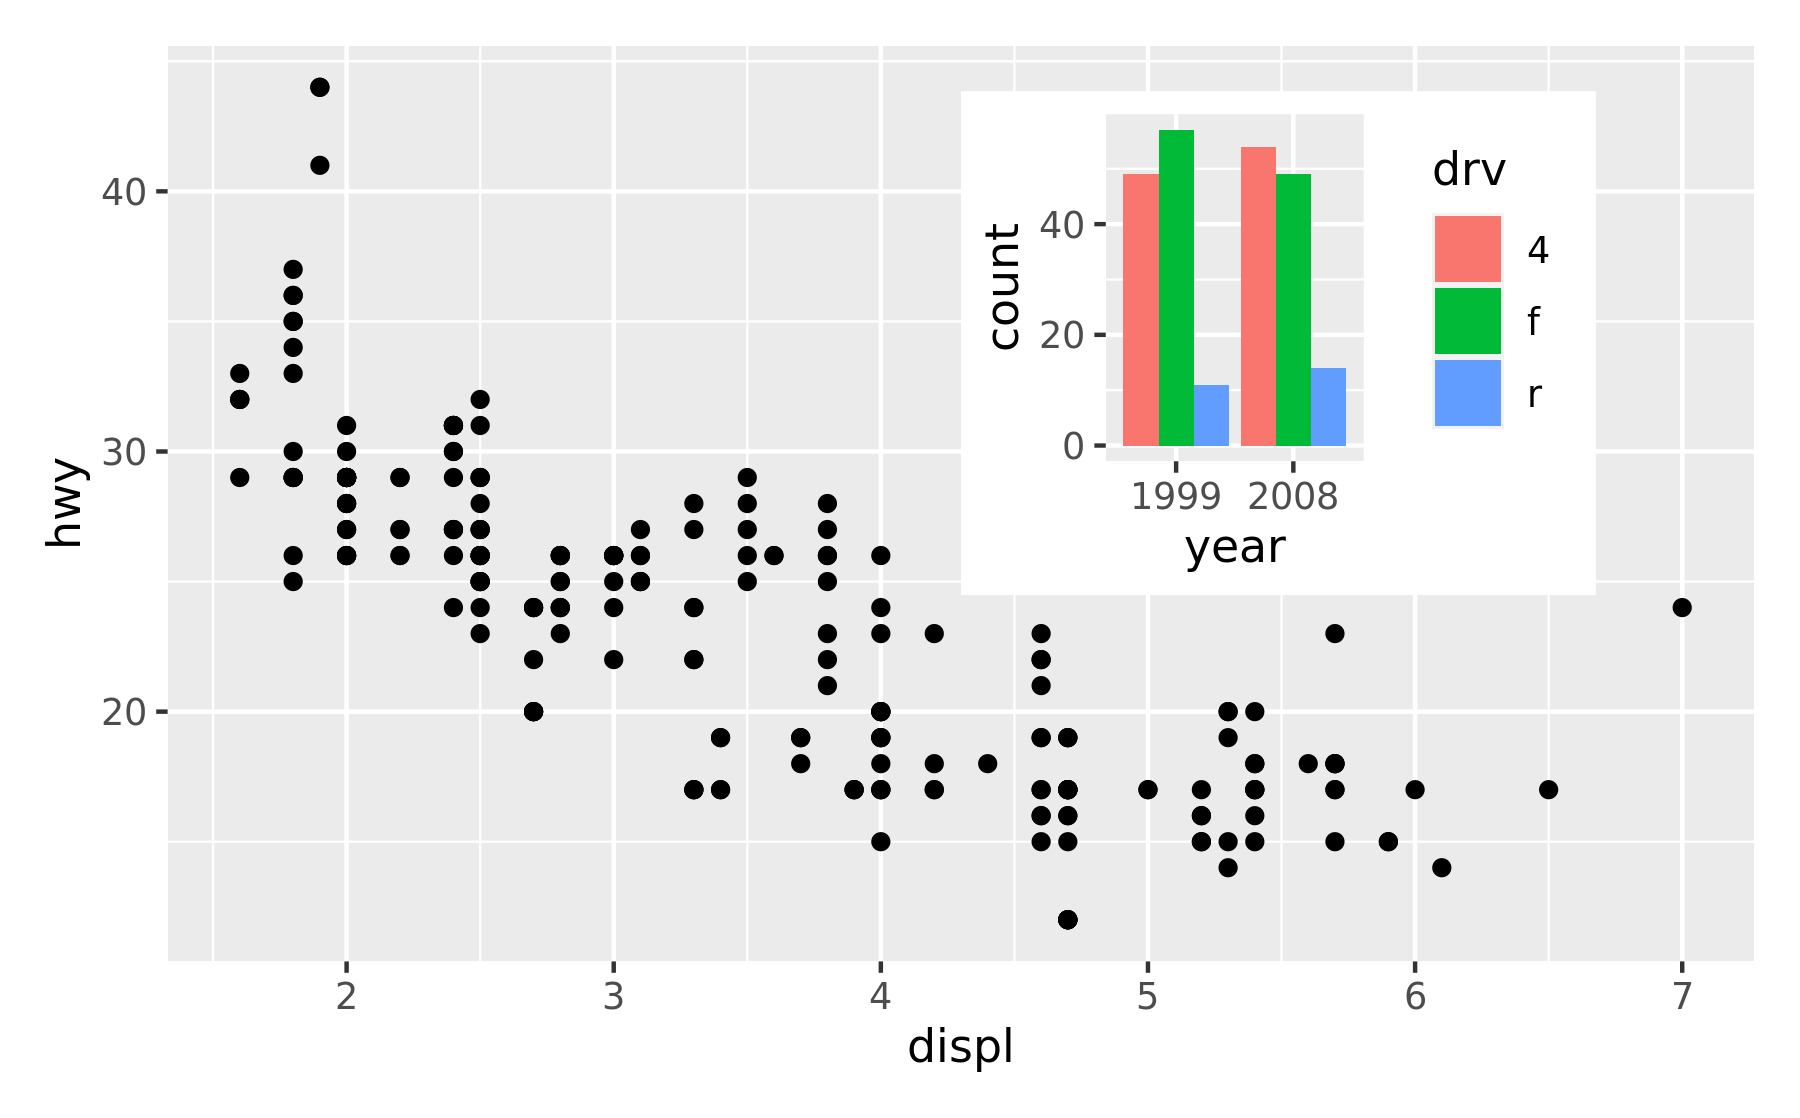
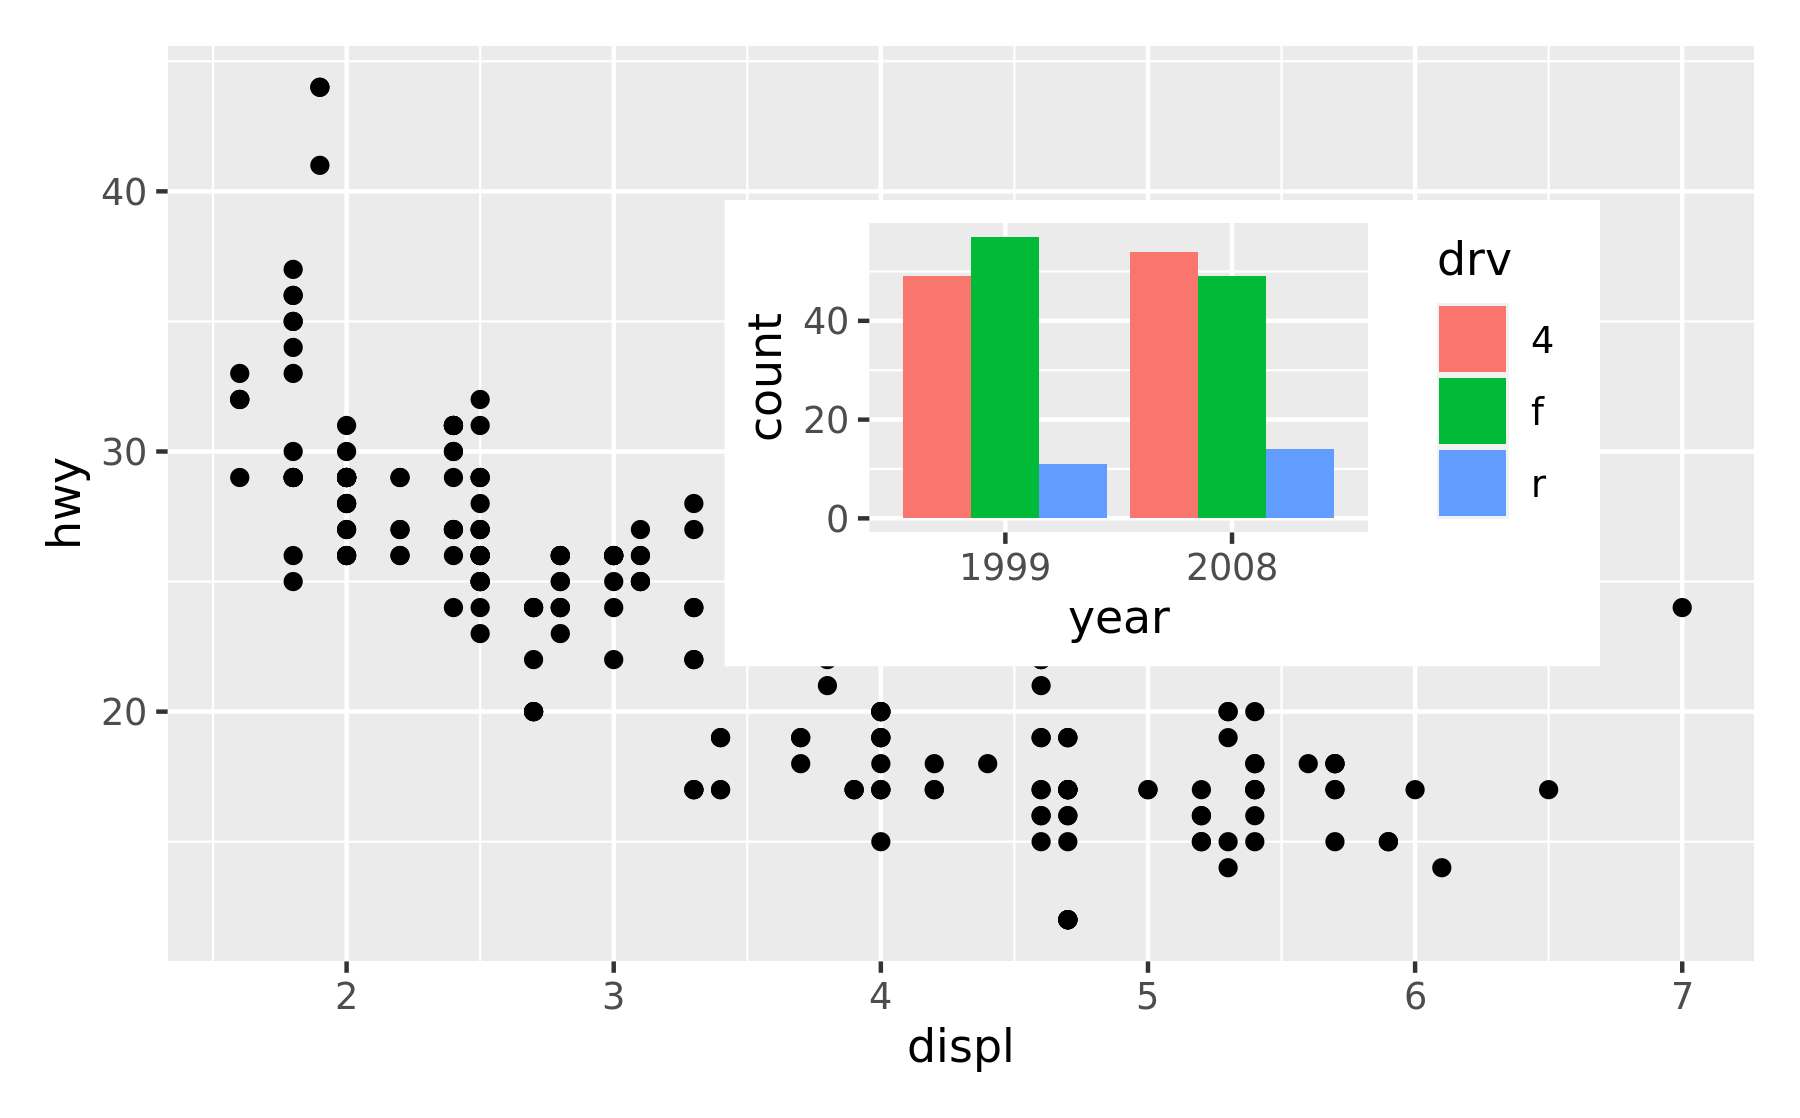
The position is specified by given the left, right, top, and bottom location of the inset. The default is to use npc units which goes from 0 to 1 in the given area, but any grid::unit() can be used by giving them explicitly. The location is by default set to the panel area, but this can be changed with the align_to argument. Combining all this we can place an inset exactly 15 mm from the top right corner like this:
p1 +
  inset_element(
    p2,
    left = 0.4,
    bottom = 0.4,
    right = unit(1, "npc") - unit(15, "mm"),
    top = unit(1, "npc") - unit(15, "mm"),
    align_to = "full"
  )
insets are not confined to ggplots. Any graphics supported by wrap_elements() can be used, including patchworks:
p24 <- p2 / p4 + plot_layout(guides = "collect")
p1 + inset_element(p24, left = 0.5, bottom = 0.05, right = 0.95, top = 0.9)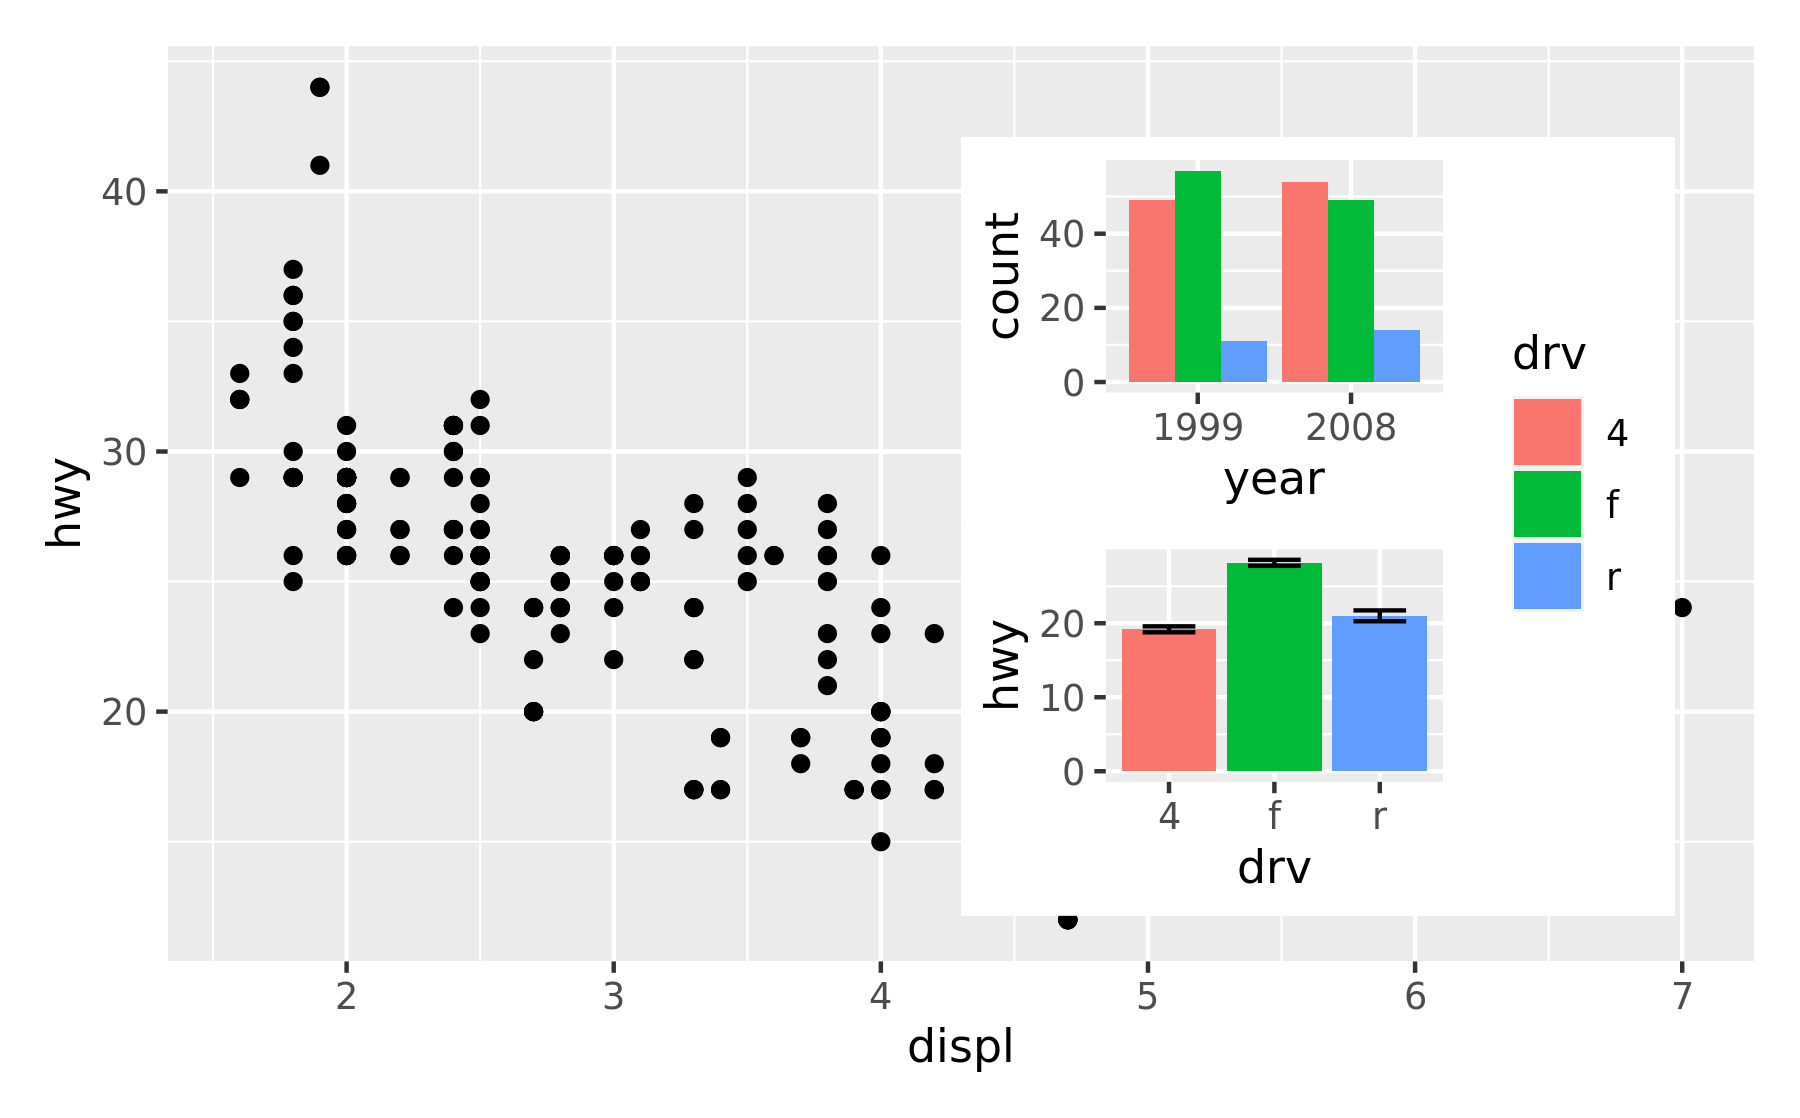
A nice feature of insets is that they behave as standard patchwork subplots until they are rendered. This means that they are amenable to modifications after assembly, e.g. using &:
p12 <- p1 + inset_element(p2, left = 0.5, bottom = 0.5, right = 0.9, top = 0.95)
p12 & theme_bw()
And auto tagging works as expected as well:
p12 + plot_annotation(tag_levels = 'A')