17.3 Modifying theme components
To modify an individual theme component you use code like plot + theme(element.name = element_function()). In this section you’ll learn about the basic element functions, and then in the next section, you’ll see all the elements that you can modify.
There are four basic types of built-in element functions: text, lines, rectangles, and blank. Each element function has a set of parameters that control the appearance:
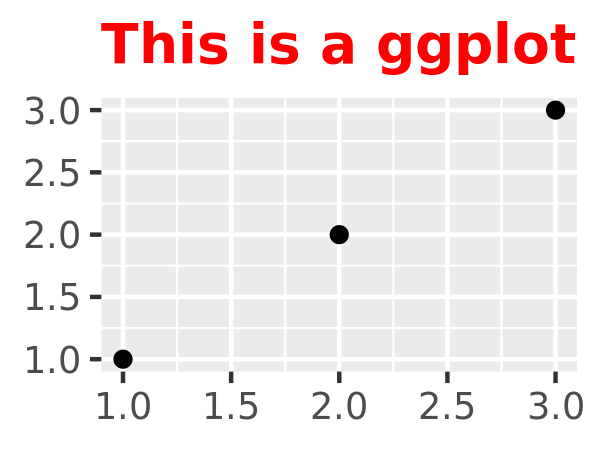
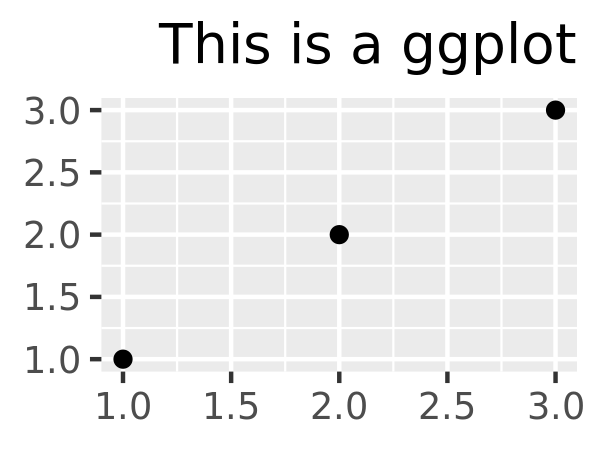
element_text()draws labels and headings. You can control the fontfamily,face,colour,size(in points),hjust,vjust,angle(in degrees) andlineheight(as ratio offontcase). More details on the parameters can be found invignette("ggplot2-specs"). Setting the font face is particularly challenging.base_t <- base + labs(title = "This is a ggplot") + xlab(NULL) + ylab(NULL) base_t + theme(plot.title = element_text(size = 16)) base_t + theme(plot.title = element_text(face = "bold", colour = "red")) base_t + theme(plot.title = element_text(hjust = 1))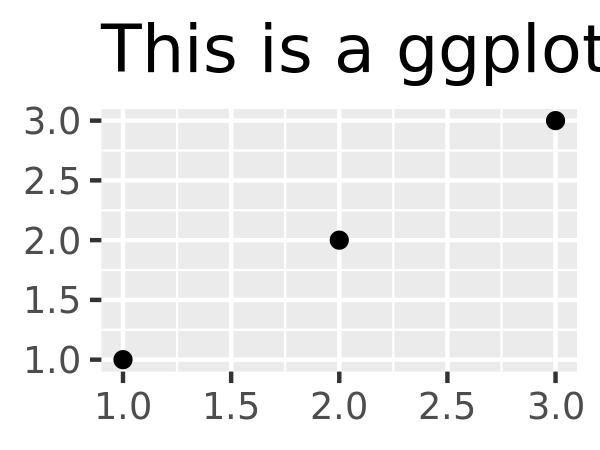
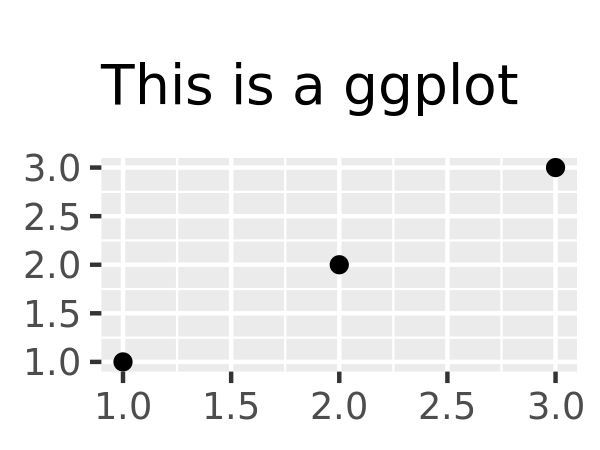
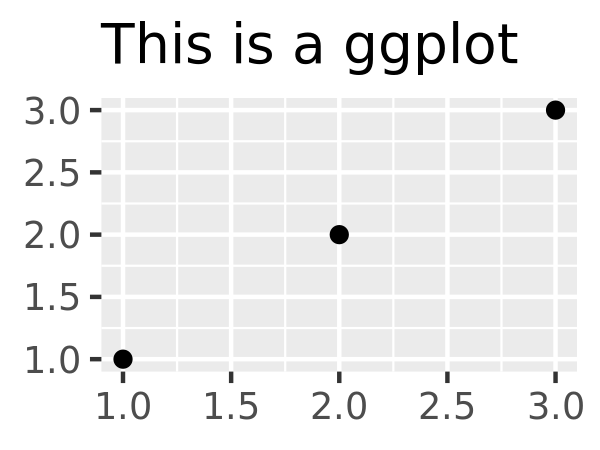
You can control the margins around the text with the
marginargument andmargin()function.margin()has four arguments: the amount of space (in points) to add to the top, right, bottom and left sides of the text. Any elements not specified default to 0.# The margins here look asymmetric because there are also plot margins base_t + theme(plot.title = element_text(margin = margin())) base_t + theme(plot.title = element_text(margin = margin(t = 10, b = 10))) base_t + theme(axis.title.y = element_text(margin = margin(r = 10)))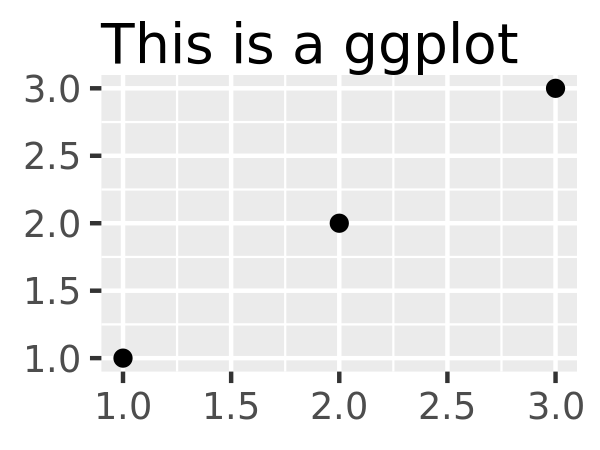
element_line()draws lines parameterised bycolour,sizeandlinetype:base + theme(panel.grid.major = element_line(colour = "black")) base + theme(panel.grid.major = element_line(size = 2)) base + theme(panel.grid.major = element_line(linetype = "dotted"))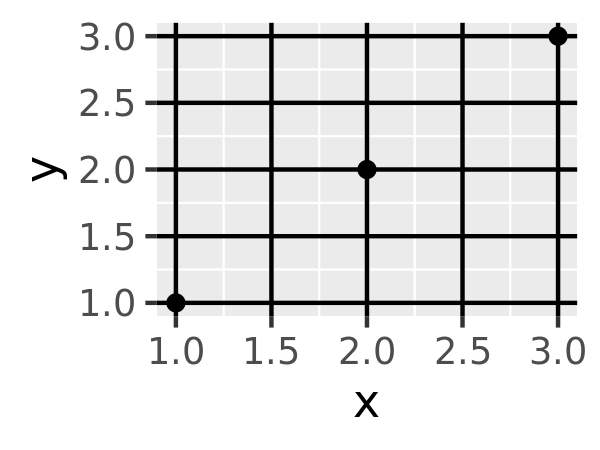

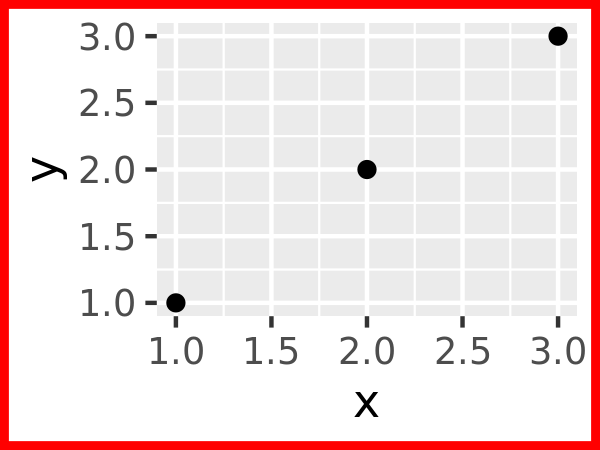
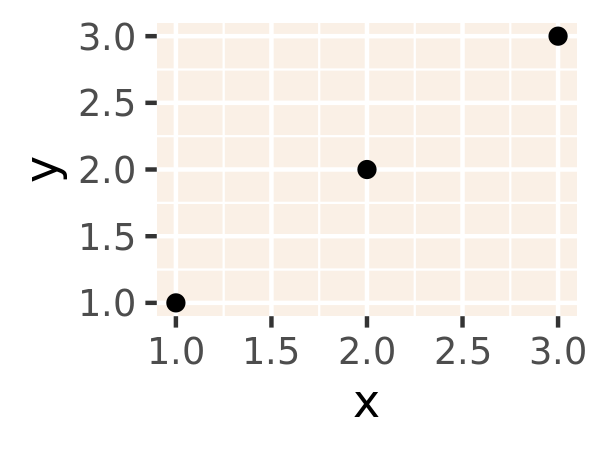
element_rect()draws rectangles, mostly used for backgrounds, parameterised byfillcolour and bordercolour,sizeandlinetype.
base + theme(plot.background = element_rect(fill = "grey80", colour = NA))
base + theme(plot.background = element_rect(colour = "red", size = 2))
base + theme(panel.background = element_rect(fill = "linen"))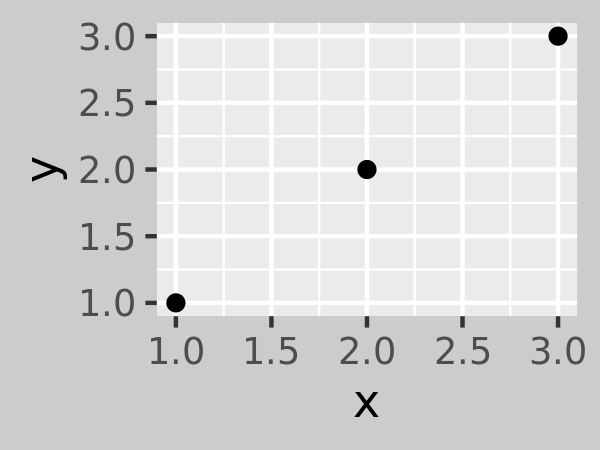
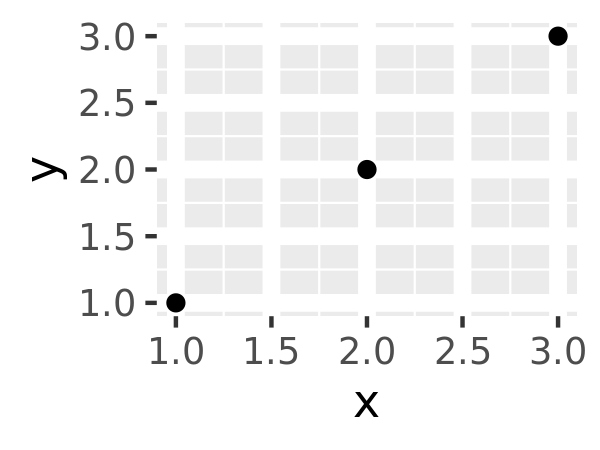
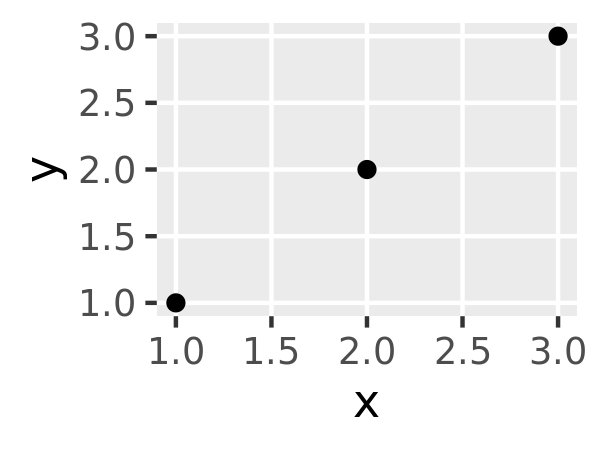
element_blank()draws nothing. Use this if you don’t want anything drawn, and no space allocated for that element. The following example useselement_blank()to progressively suppress the appearance of elements we’re not interested in. Notice how the plot automatically reclaims the space previously used by these elements: if you don’t want this to happen (perhaps because they need to line up with other plots on the page), usecolour = NA, fill = NAto create invisible elements that still take up space.base last_plot() + theme(panel.grid.minor = element_blank()) last_plot() + theme(panel.grid.major = element_blank())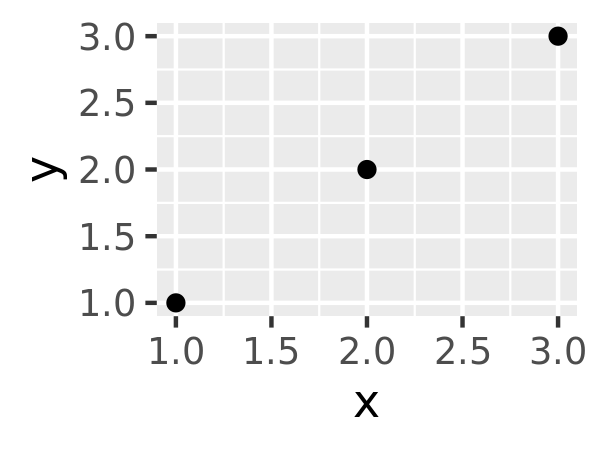

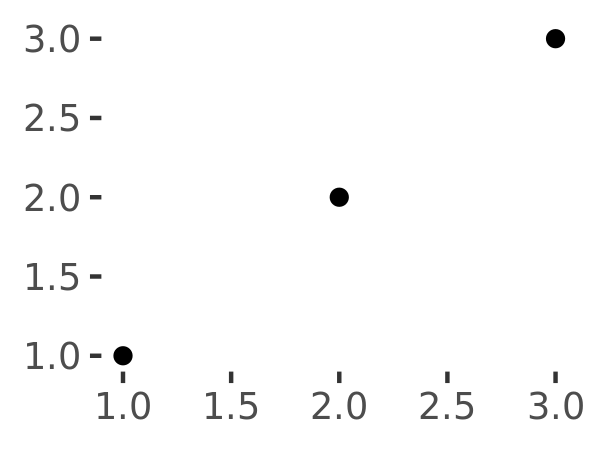
last_plot() + theme(panel.background = element_blank())
last_plot() + theme(
  axis.title.x = element_blank(),
  axis.title.y = element_blank()
)
last_plot() + theme(axis.line = element_line(colour = "grey50"))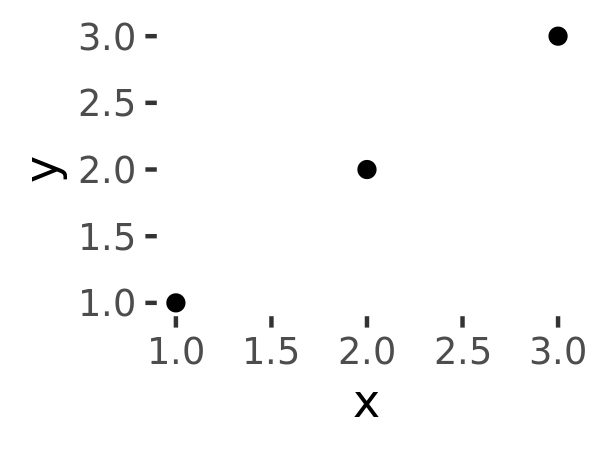
A few other settings take grid units. Create them with
unit(1, "cm")orunit(0.25, "in").
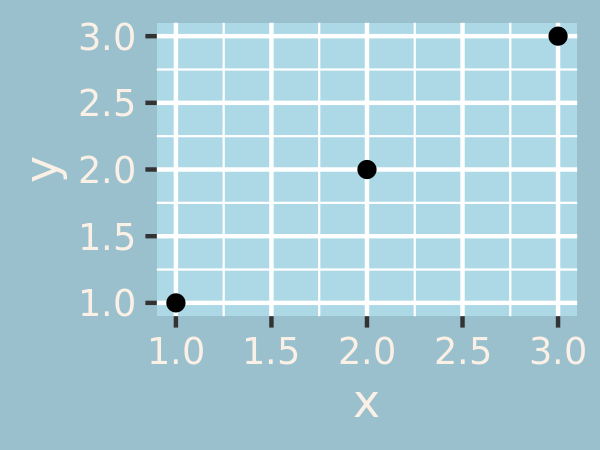
To modify theme elements for all future plots, use theme_update(). It returns the previous theme settings, so you can easily restore the original parameters once you’re done.
old_theme <- theme_update(
  plot.background = element_rect(fill = "lightblue3", colour = NA),
  panel.background = element_rect(fill = "lightblue", colour = NA),
  axis.text = element_text(colour = "linen"),
  axis.title = element_text(colour = "linen")
)
base
theme_set(old_theme)
base