16.6 Continuous variables
To facet continuous variables, you must first discretise them. ggplot2 provides three helper functions to do so:
Divide the data into
nbins each of the same length:cut_interval(x, n)Divide the data into bins of width
width:cut_width(x, width).Divide the data into n bins each containing (approximately) the same number of points:
cut_number(x, n = 10).
They are illustrated below:
# Bins of width 1
mpg2$disp_w <- cut_width(mpg2$displ, 1)
# Six bins of equal length
mpg2$disp_i <- cut_interval(mpg2$displ, 6)
# Six bins containing equal numbers of points
mpg2$disp_n <- cut_number(mpg2$displ, 6)

plot <- ggplot(mpg2, aes(cty, hwy)) +
  geom_point() +
  labs(x = NULL, y = NULL)
plot + facet_wrap(~disp_w, nrow = 1)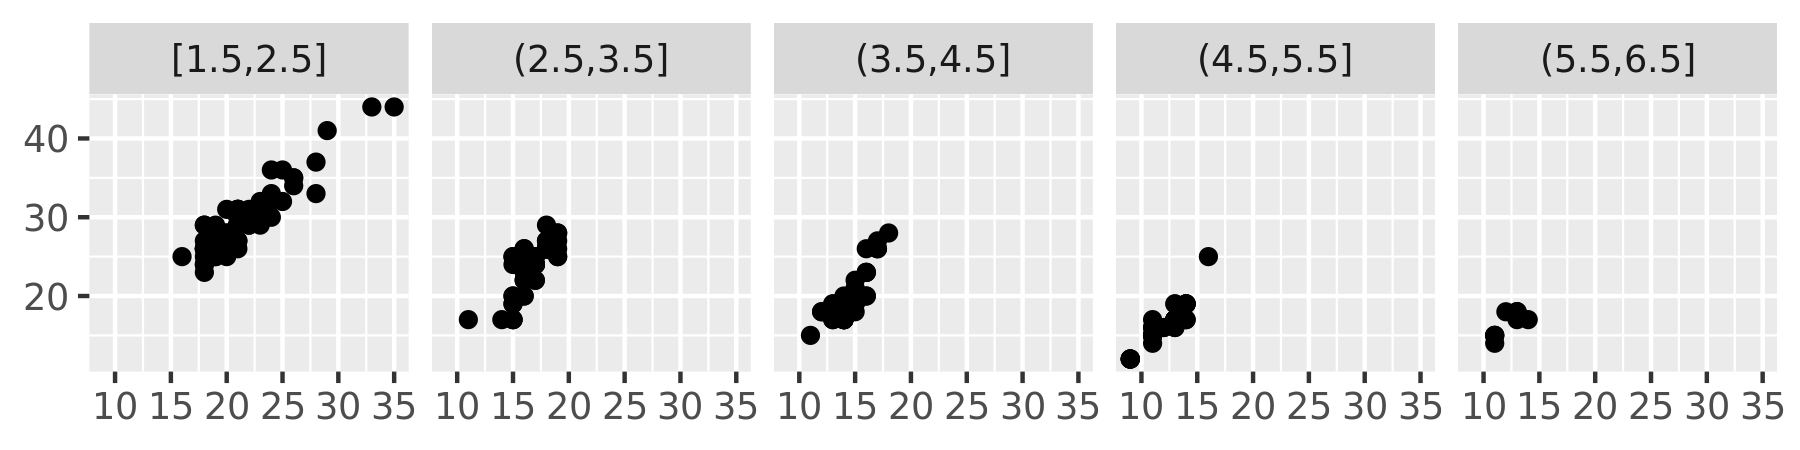
plot + facet_wrap(~disp_i, nrow = 1)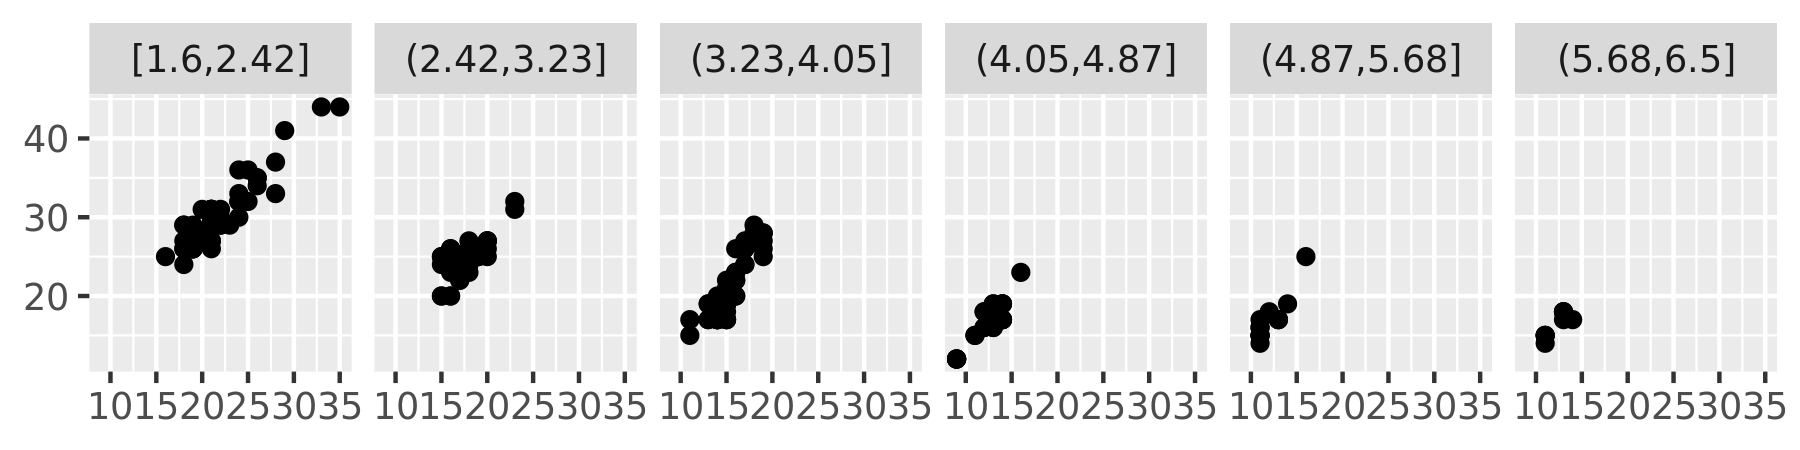
plot + facet_wrap(~disp_n, nrow = 1)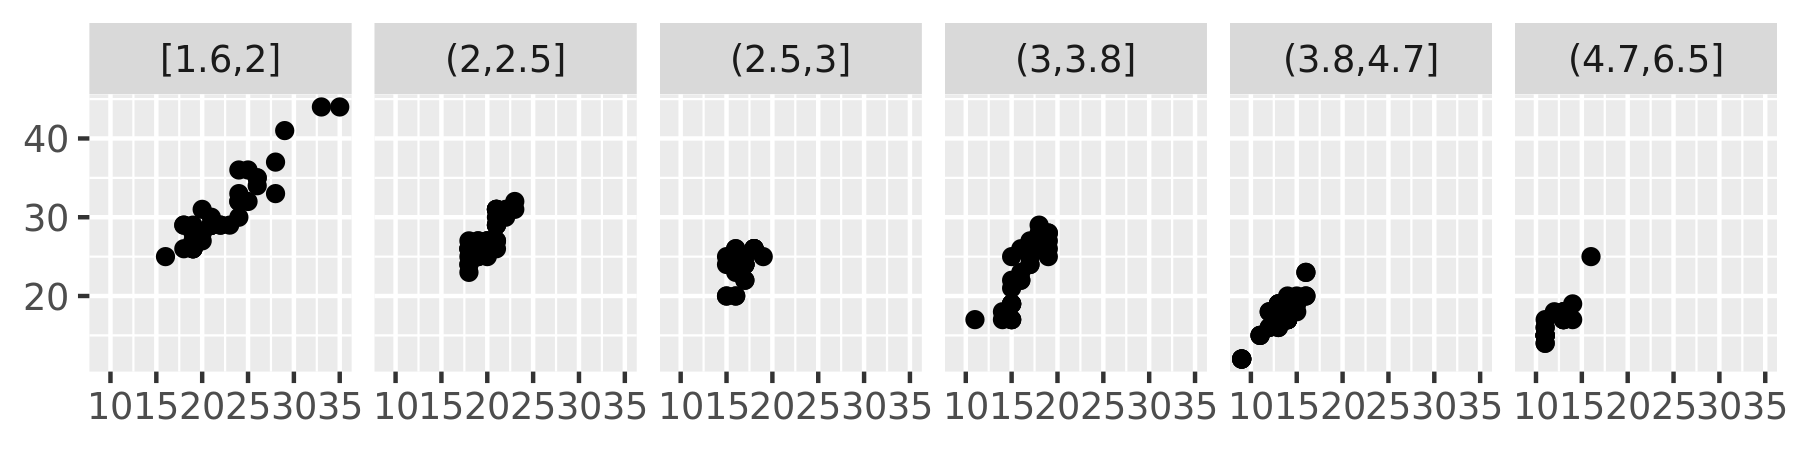
Note that the faceting formula does not evaluate functions, so you must first create a new variable containing the discretised data.