4.2 Different groups on different layers
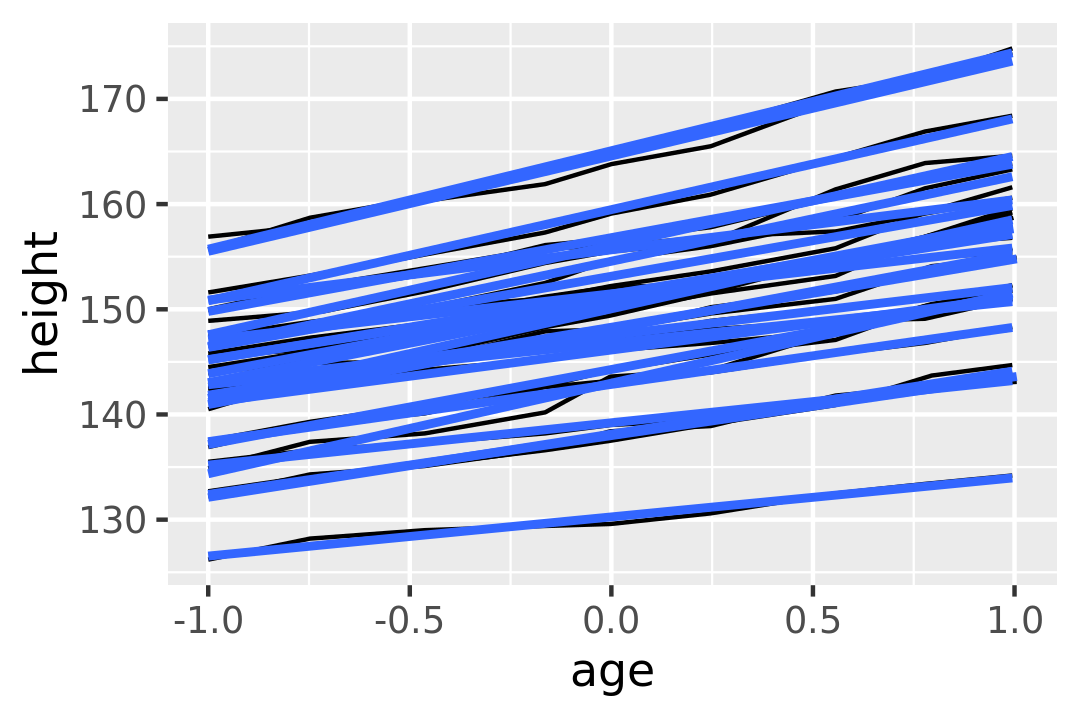
Sometimes we want to plot summaries that use different levels of aggregation: one layer might display individuals, while another displays an overall summary. Building on the previous example, suppose we want to add a single smooth line, showing the overall trend for all boys. If we use the same grouping in both layers, we get one smooth per boy:
ggplot(Oxboys, aes(age, height, group = Subject)) +
  geom_line() +
  geom_smooth(method = "lm", se = FALSE)
#> `geom_smooth()` using formula 'y ~ x'
This is not what we wanted; we have inadvertently added a smoothed line for each boy. Grouping controls both the display of the geoms, and the operation of the stats: one statistical transformation is run for each group.
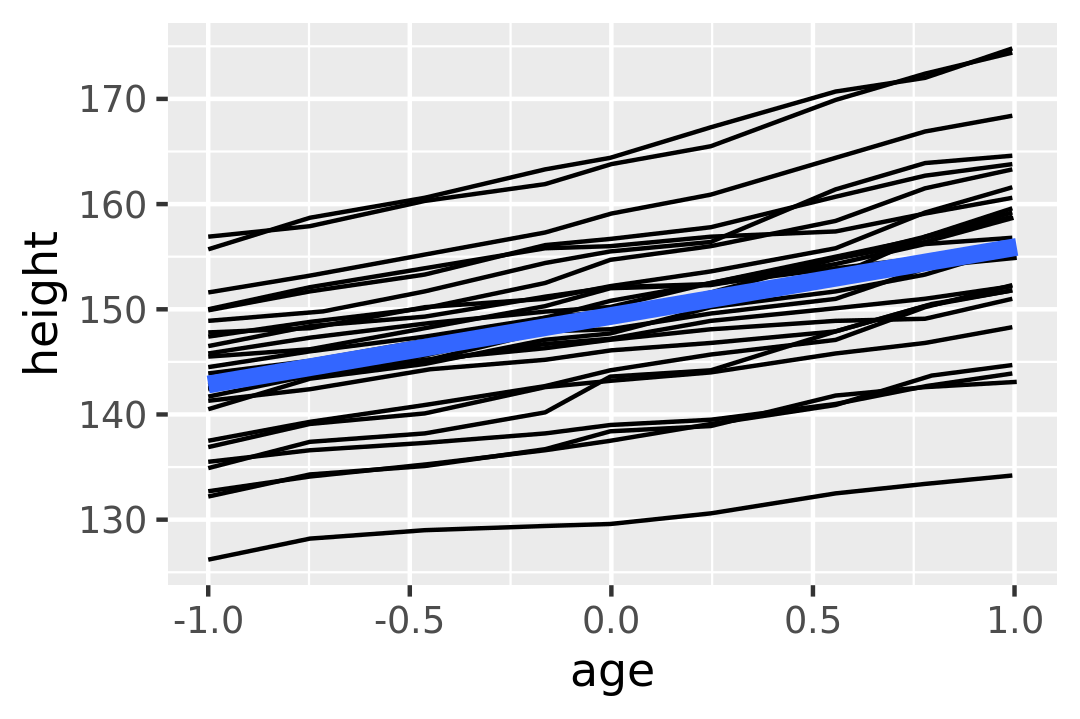
Instead of setting the grouping aesthetic in ggplot(), where it will apply to all layers, we set it in geom_line() so it applies only to the lines. There are no discrete variables in the plot so the default grouping variable will be a constant and we get one smooth:
ggplot(Oxboys, aes(age, height)) +
  geom_line(aes(group = Subject)) +
  geom_smooth(method = "lm", size = 2, se = FALSE)
#> `geom_smooth()` using formula 'y ~ x'