13.7 Position adjustments
Position adjustments apply minor tweaks to the position of elements within a layer. Three adjustments apply primarily to bars:
position_stack(): stack overlapping bars (or areas) on top of each other.position_fill(): stack overlapping bars, scaling so the top is always at 1.position_dodge(): place overlapping bars (or boxplots) side-by-side.
dplot <- ggplot(diamonds, aes(color, fill = cut)) +
xlab(NULL) + ylab(NULL) + theme(legend.position = "none")
# position stack is the default for bars, so `geom_bar()`
# is equivalent to `geom_bar(position = "stack")`.
dplot + geom_bar()
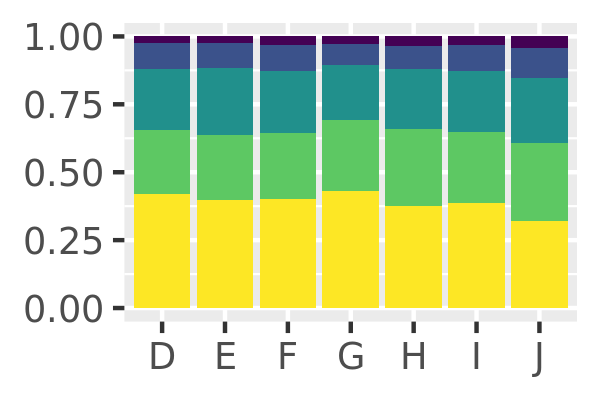
dplot + geom_bar(position = "fill")
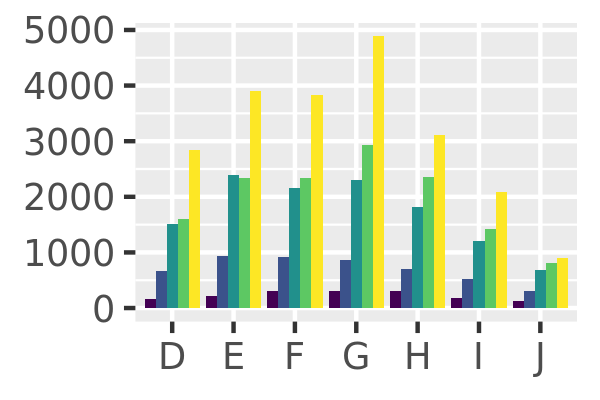
dplot + geom_bar(position = "dodge")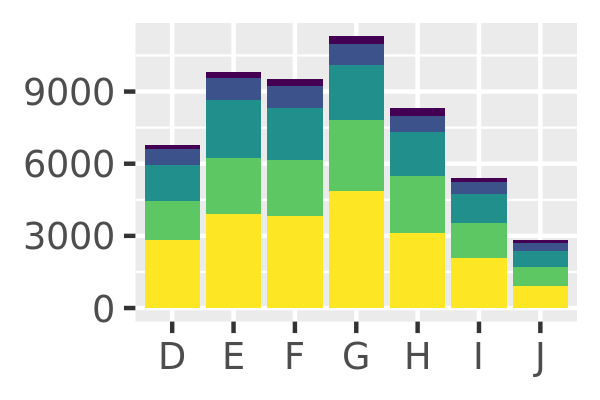
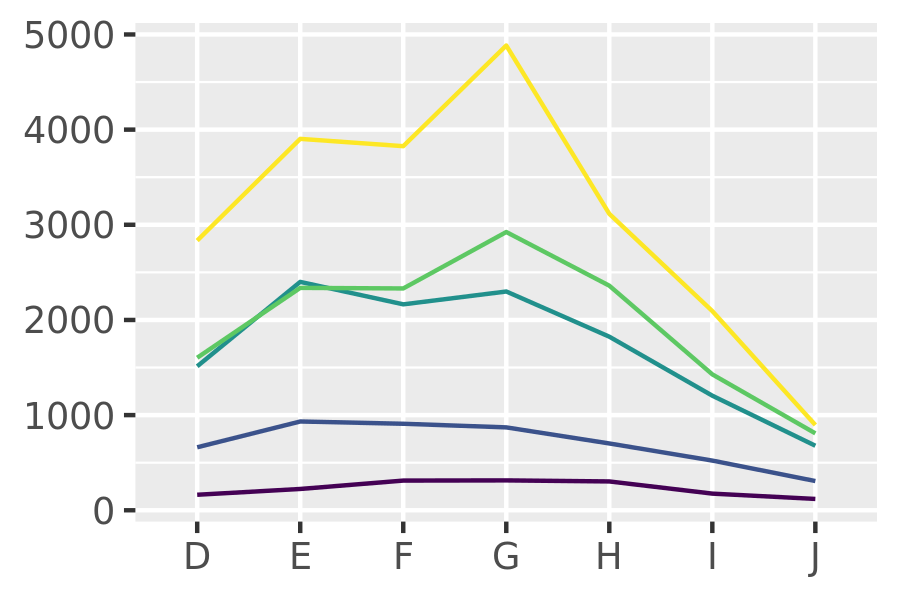
There’s also a position adjustment that does nothing: position_identity(). The identity position adjustment isn’t useful for bars, because each bar obscures the bars behind, but there are many geoms that don’t need adjusting, like lines:
dplot + geom_bar(position = "identity", alpha = 1 / 2, colour = "grey50")

ggplot(diamonds, aes(color, colour = cut)) +
  geom_line(aes(group = cut), stat = "count") +
  xlab(NULL) + ylab(NULL) +
  theme(legend.position = "none")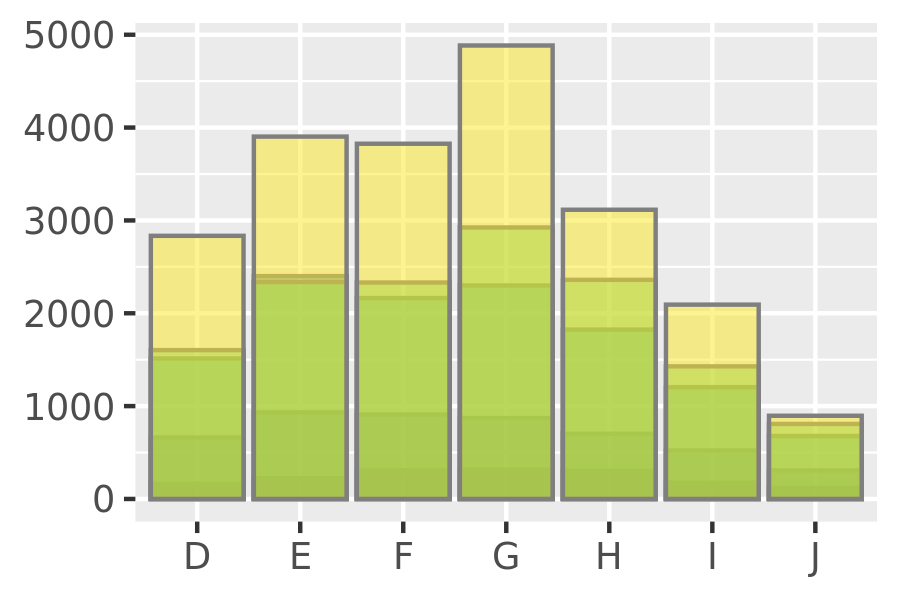
There are three position adjustments that are primarily useful for points:
position_nudge(): move points by a fixed offset.position_jitter(): add a little random noise to every position.position_jitterdodge(): dodge points within groups, then add a little random noise.
Note that the way you pass parameters to position adjustments differs to stats and geoms. Instead of including additional arguments in ..., you construct a position adjustment object, supplying additional arguments in the call:
ggplot(mpg, aes(displ, hwy)) +
  geom_point(position = "jitter")
ggplot(mpg, aes(displ, hwy)) +
  geom_point(position = position_jitter(width = 0.05, height = 0.5))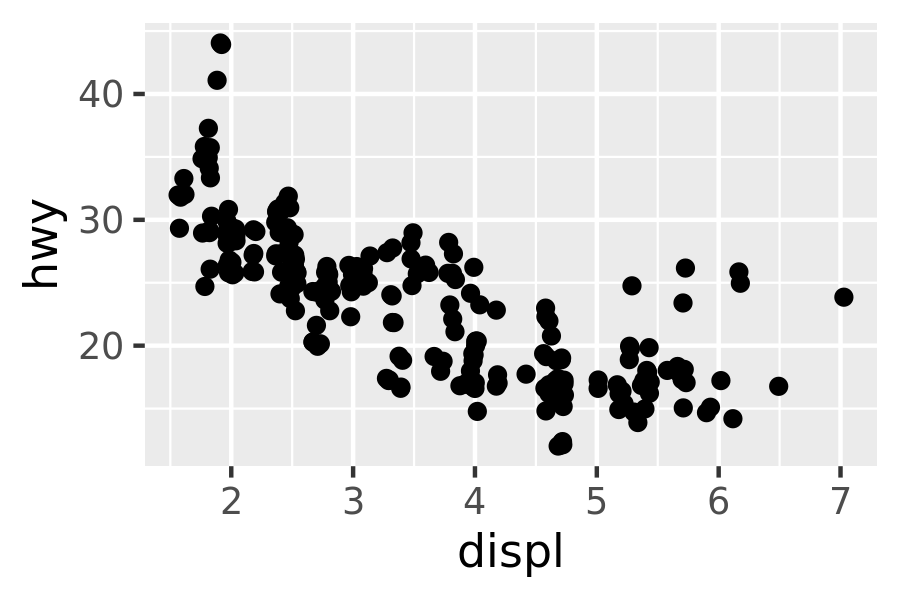
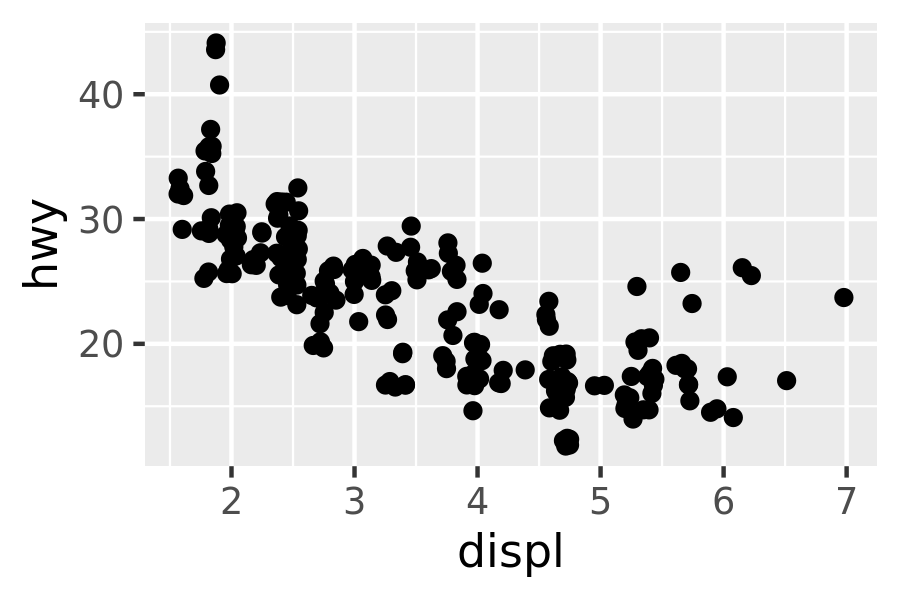
This is rather verbose, so geom_jitter() provides a convenient shortcut:
ggplot(mpg, aes(displ, hwy)) +
  geom_jitter(width = 0.05, height = 0.5)
Continuous data typically doesn’t overlap exactly, and when it does (because of high data density) minor adjustments, like jittering, are often insufficient to fix the problem. For this reason, position adjustments are generally most useful for discrete data.
13.7.1 Exercises
When might you use
position_nudge()? Read the documentation.Many position adjustments can only be used with a few geoms. For example, you can’t stack boxplots or errors bars. Why not? What properties must a geom possess in order to be stackable? What properties must it possess to be dodgeable?
Why might you use
geom_jitter()instead ofgeom_count()? What are the advantages and disadvantages of each technique?When might you use a stacked area plot? What are the advantages and disadvantages compared to a line plot?