9.4 Binned
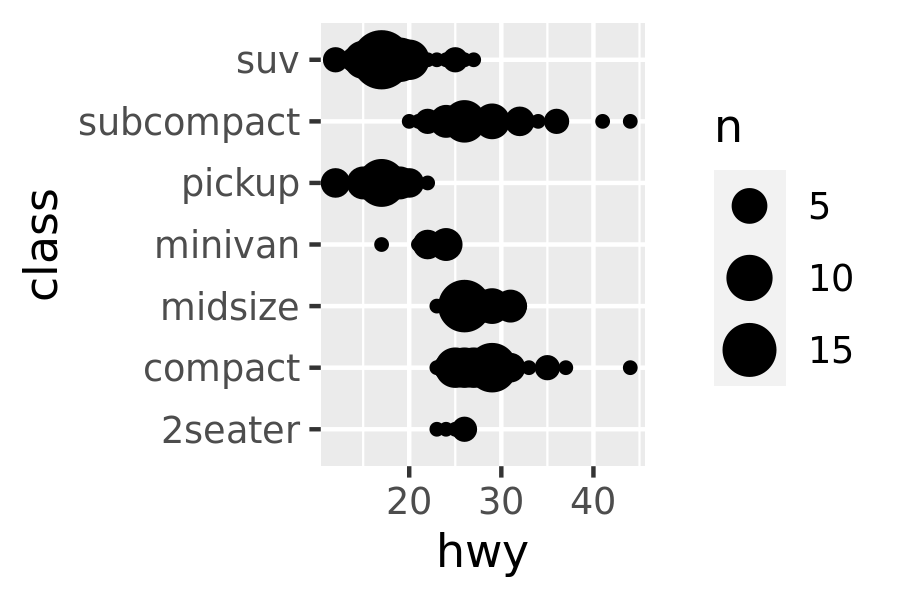
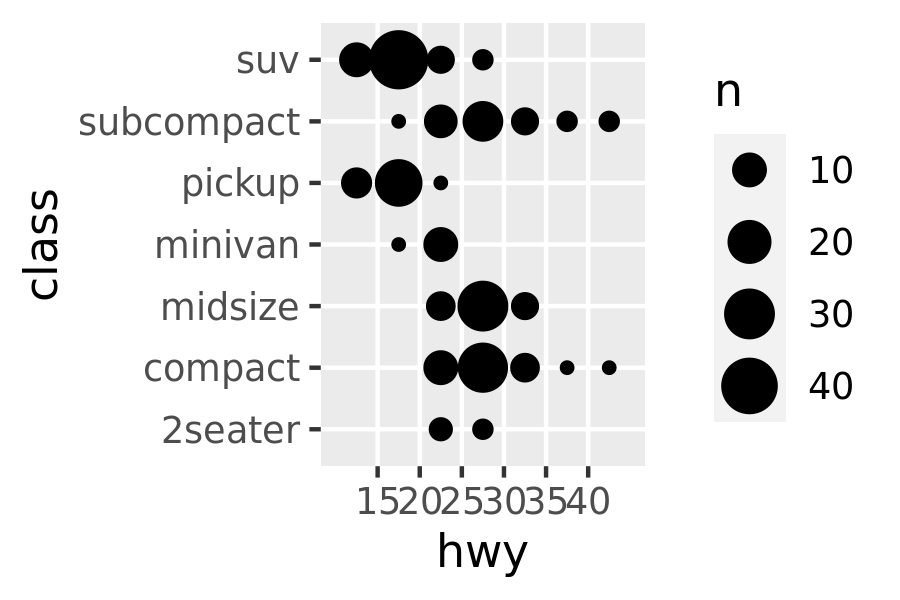
A variation on discrete position scales are binned scales, where a continuous variable is sliced into multiple bins and the discretised variable is plotted. For example, if we want to modify the plot above to show the number of observations at each location, we could use geom_count() instead of geom_point() so that the size of the dots scales with the number of observations. As the left plot below illustrates, this is an improvement but is still rather cluttered. To improve this, the plot on the right uses scale_x_binned() to cut the hwy values into 10 bins before passing them to the geom:
base <- ggplot(mpg, aes(hwy, class)) + geom_count()

base
base + scale_x_binned(n.breaks = 10)