13.2 Building a plot
So far, whenever we’ve created a plot with ggplot(), we’ve immediately added on a layer with a geom function. But it’s important to realise that there really are two distinct steps. First we create a plot with default dataset and aesthetic mappings:
p <- ggplot(mpg, aes(displ, hwy))
p
There’s nothing to see yet, so we need to add a layer:
p + geom_point()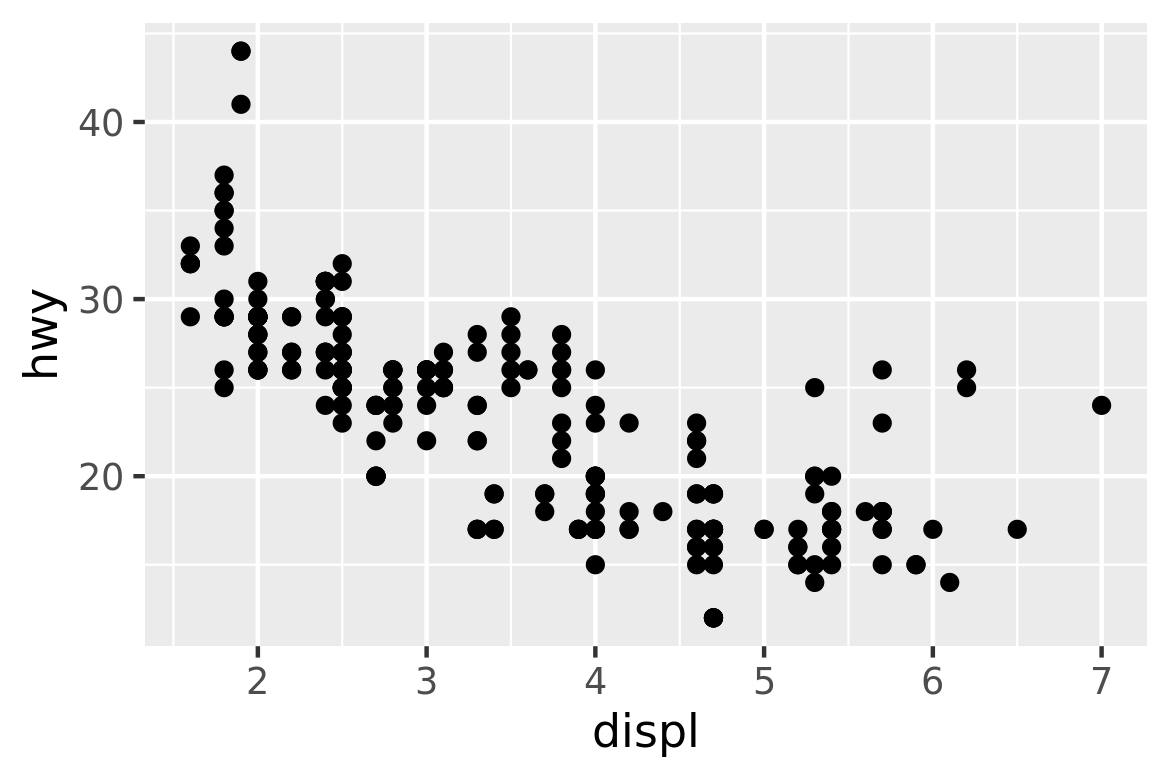
geom_point() is a shortcut. Behind the scenes it calls the layer() function to create a new layer:
p + layer(
  mapping = NULL,
  data = NULL,
  geom = "point",
  stat = "identity",
  position = "identity"
)
This call fully specifies the five components to the layer:
mapping: A set of aesthetic mappings, specified using the
aes()function and combined with the plot defaults as described in Section 13.4. IfNULL, uses the default mapping set inggplot().data: A dataset which overrides the default plot dataset. It is usually omitted (set to
NULL), in which case the layer will use the default data specified inggplot(). The requirements for data are explained in more detail in Section 13.3.geom: The name of the geometric object to use to draw each observation. Geoms are discussed in more detail in Section 13.3, and Chapters 3 and 4 explore their use in more depth.
Geoms can have additional arguments. All geoms take aesthetics as parameters. If you supply an aesthetic (e.g. colour) as a parameter, it will not be scaled, allowing you to control the appearance of the plot, as described in Section 13.4.2. You can pass params in
...(in which case stat and geom parameters are automatically teased apart), or in a list passed togeom_params.stat: The name of the statistical tranformation to use. A statistical transformation performs some useful statistical summary, and is key to histograms and smoothers. To keep the data as is, use the “identity” stat. Learn more in Section 13.6.
You only need to set one of stat and geom: every geom has a default stat, and every stat a default geom.
Most stats take additional parameters to specify the details of statistical transformation. You can supply params either in
...(in which case stat and geom parameters are automatically teased apart), or in a list calledstat_params.position: The method used to adjust overlapping objects, like jittering, stacking or dodging. More details in Section 13.7.
It’s useful to understand the layer() function so you have a better mental model of the layer object. But you’ll rarely use the full layer() call because it’s so verbose. Instead, you’ll use the shortcut geom_ functions: geom_point(mapping, data, ...) is exactly equivalent to layer(mapping, data, geom = "point", ...).