15.1 Linear coordinate systems
There are three linear coordinate systems: coord_cartesian(), coord_flip(), coord_fixed().
15.1.1 Zooming into a plot with coord_cartesian()
coord_cartesian() has arguments xlim and ylim. If you think back to the scales chapter, you might wonder why we need these. Doesn’t the limits argument of the scales already allow us to control what appears on the plot? The key difference is how the limits work: when setting scale limits, any data outside the limits is thrown away; but when setting coordinate system limits we still use all the data, but we only display a small region of the plot. Setting coordinate system limits is like looking at the plot under a magnifying glass.
base <- ggplot(mpg, aes(displ, hwy)) +
geom_point() +
geom_smooth()
# Full dataset
base
#> `geom_smooth()` using method = 'loess' and formula 'y ~ x'
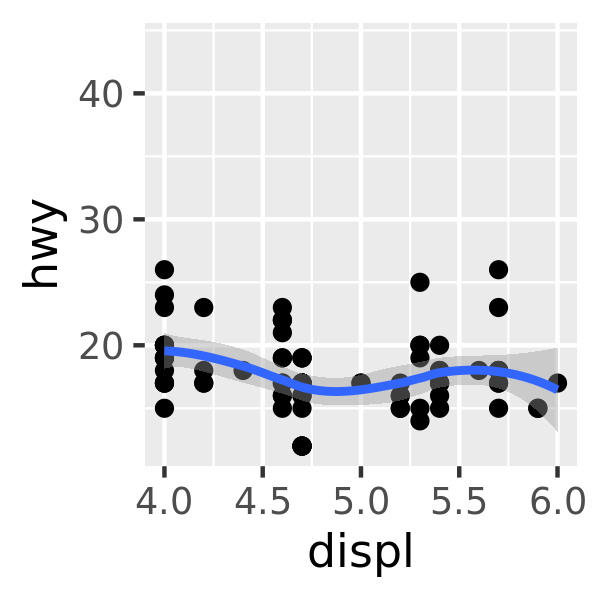
# Scaling to 4--6 throws away data outside that range
base + scale_x_continuous(limits = c(4, 6))
#> `geom_smooth()` using method = 'loess' and formula 'y ~ x'
#> Warning: Removed 153 rows containing non-finite values (stat_smooth).
#> Warning: Removed 153 rows containing missing values (geom_point).
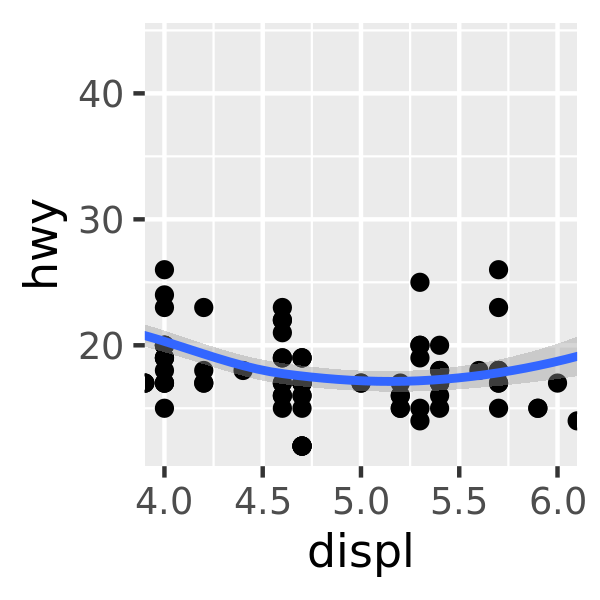
# Zooming to 4--6 keeps all the data but only shows some of it
base + coord_cartesian(xlim = c(4, 6))
#> `geom_smooth()` using method = 'loess' and formula 'y ~ x'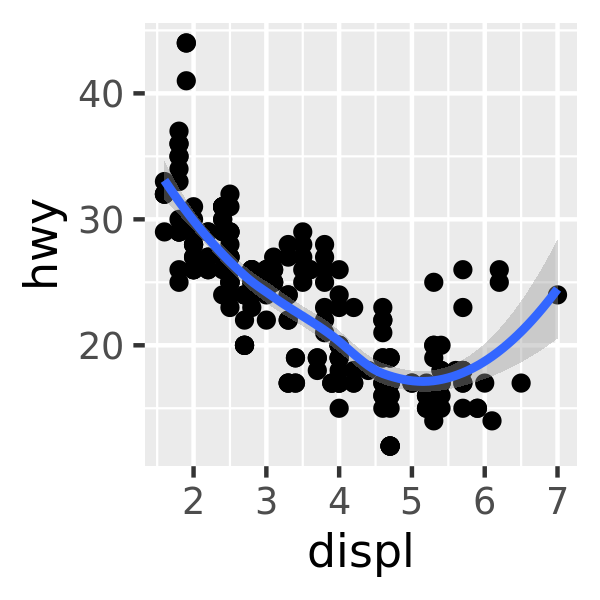
15.1.2 Flipping the axes with coord_flip()
Most statistics and geoms assume you are interested in y values conditional on x values (e.g., smooth, summary, boxplot, line): in most statistical models, the x values are assumed to be measured without error. If you are interested in x conditional on y (or you just want to rotate the plot 90 degrees), you can use coord_flip() to exchange the x and y axes. Compare this with just exchanging the variables mapped to x and y:
ggplot(mpg, aes(displ, cty)) +
geom_point() +
geom_smooth()
#> `geom_smooth()` using method = 'loess' and formula 'y ~ x'
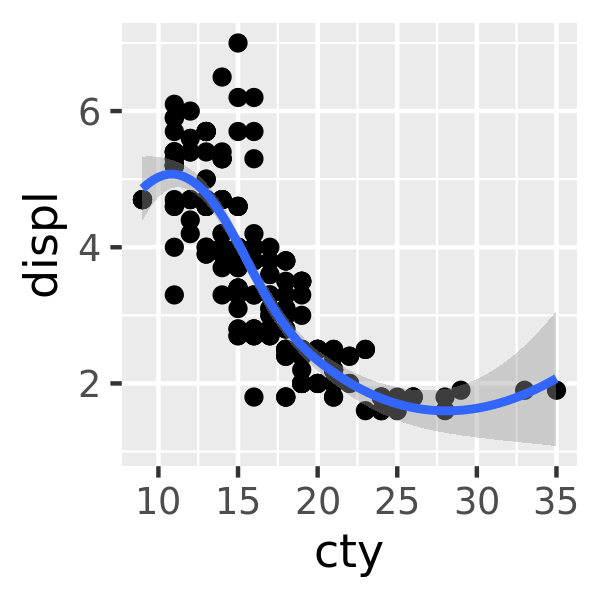
# Exchanging cty and displ rotates the plot 90 degrees, but the smooth
# is fit to the rotated data.
ggplot(mpg, aes(cty, displ)) +
geom_point() +
geom_smooth()
#> `geom_smooth()` using method = 'loess' and formula 'y ~ x'
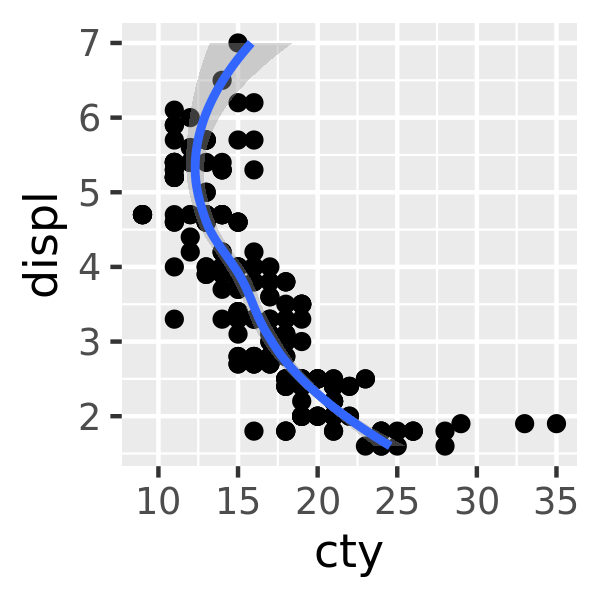
# coord_flip() fits the smooth to the original data, and then rotates
# the output
ggplot(mpg, aes(displ, cty)) +
geom_point() +
geom_smooth() +
coord_flip()
#> `geom_smooth()` using method = 'loess' and formula 'y ~ x'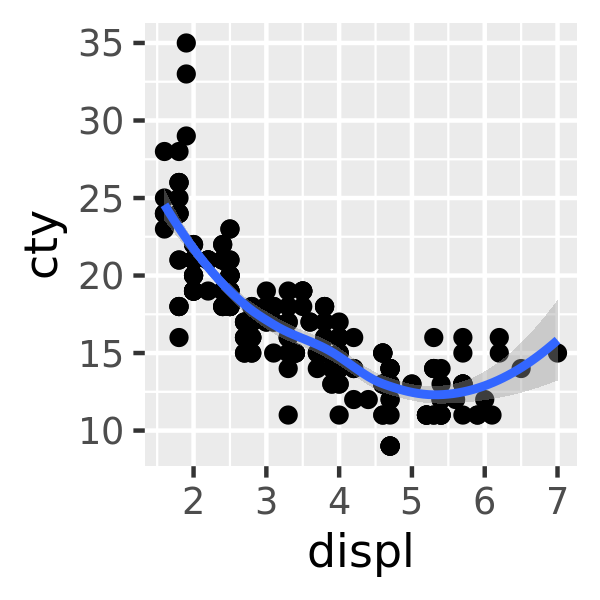
15.1.3 Equal scales with coord_fixed()
coord_fixed() fixes the ratio of length on the x and y axes. The default ratio ensures that the x and y axes have equal scales: i.e., 1 cm along the x axis represents the same range of data as 1 cm along the y axis. The aspect ratio will also be set to ensure that the mapping is maintained regardless of the shape of the output device. See the documentation of coord_fixed() for more details.