16.3 Controlling scales
For both facet_wrap() and facet_grid() you can control whether the position scales are the same in all panels (fixed) or allowed to vary between panels (free) with the scales parameter:
scales = "fixed": x and y scales are fixed across all panels.scales = "free_x": the x scale is free, and the y scale is fixed.scales = "free_y": the y scale is free, and the x scale is fixed.scales = "free": x and y scales vary across panels.
facet_grid() imposes an additional constraint on the scales: all panels in a column must have the same x scale, and all panels in a row must have the same y scale. This is because each column shares an x axis, and each row shares a y axis.
Fixed scales make it easier to see patterns across panels; free scales make it easier to see patterns within panels.
p <- ggplot(mpg2, aes(cty, hwy)) +
  geom_abline() +
  geom_jitter(width = 0.1, height = 0.1)
p + facet_wrap(~cyl)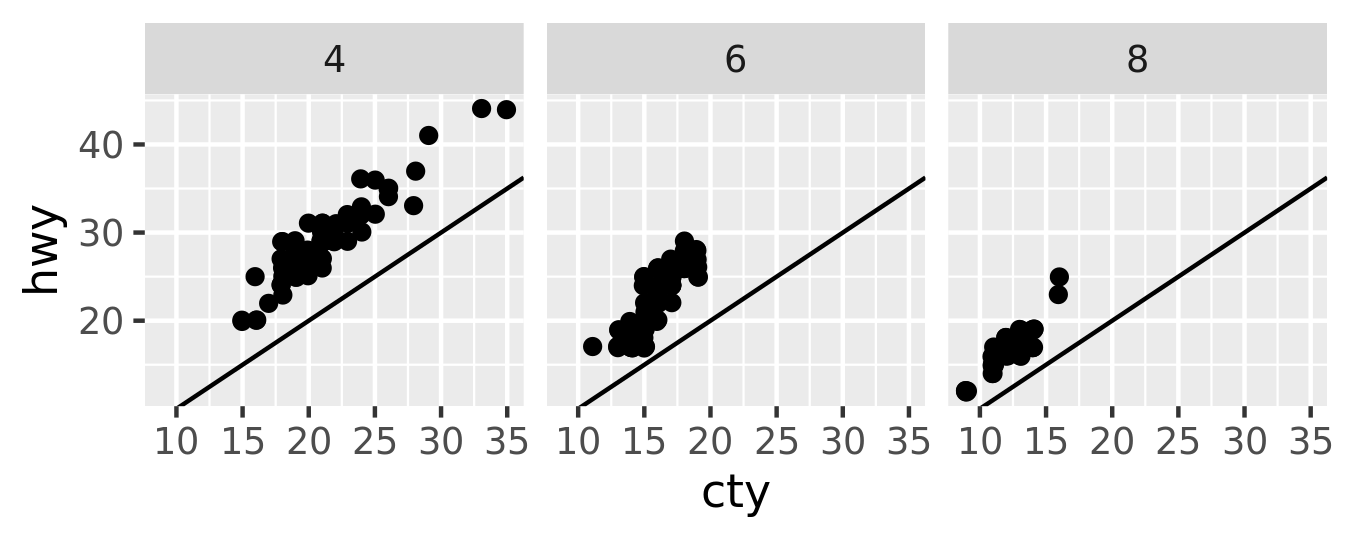
p + facet_wrap(~cyl, scales = "free")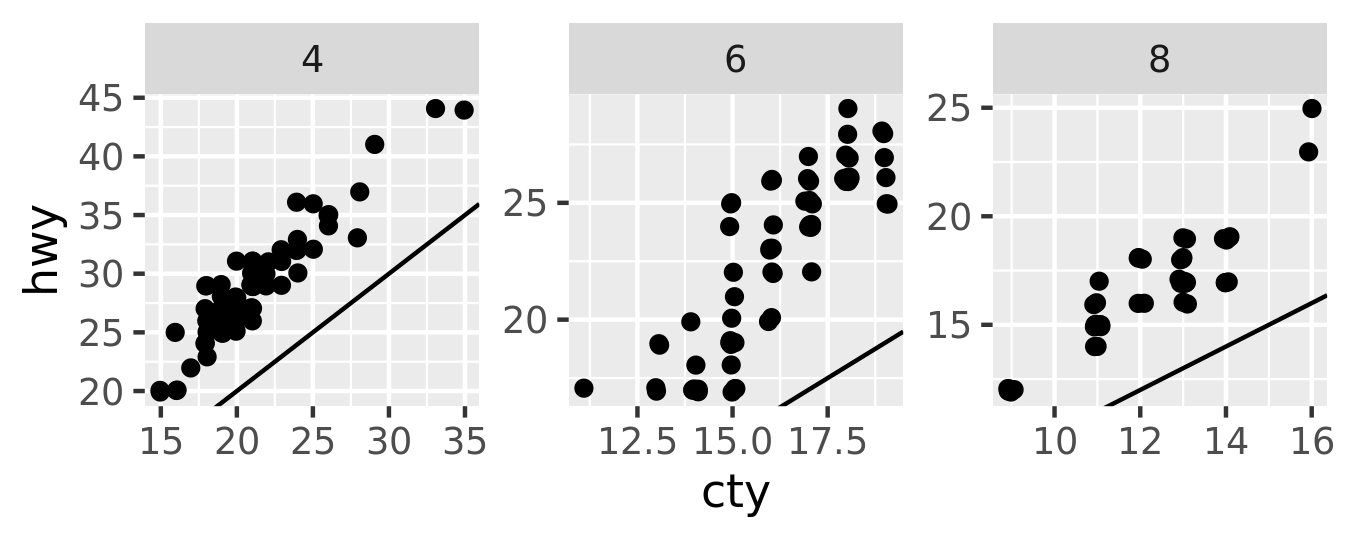
Free scales are also useful when we want to display multiple time series that were measured on different scales. To do this, we first need to change from ‘wide’ to ‘long’ data, stacking the separate variables into a single column. An example of this is shown below with the long form of the economics data.
economics_long
#> # A tibble: 2,870 x 4
#>   date       variable value  value01
#>   <date>     <chr>    <dbl>    <dbl>
#> 1 1967-07-01 pce       507. 0
#> 2 1967-08-01 pce       510. 0.000265
#> 3 1967-09-01 pce       516. 0.000762
#> 4 1967-10-01 pce       512. 0.000471
#> 5 1967-11-01 pce       517. 0.000916
#> 6 1967-12-01 pce       525. 0.00157
#> # … with 2,864 more rows
ggplot(economics_long, aes(date, value)) +
  geom_line() +
  facet_wrap(~variable, scales = "free_y", ncol = 1)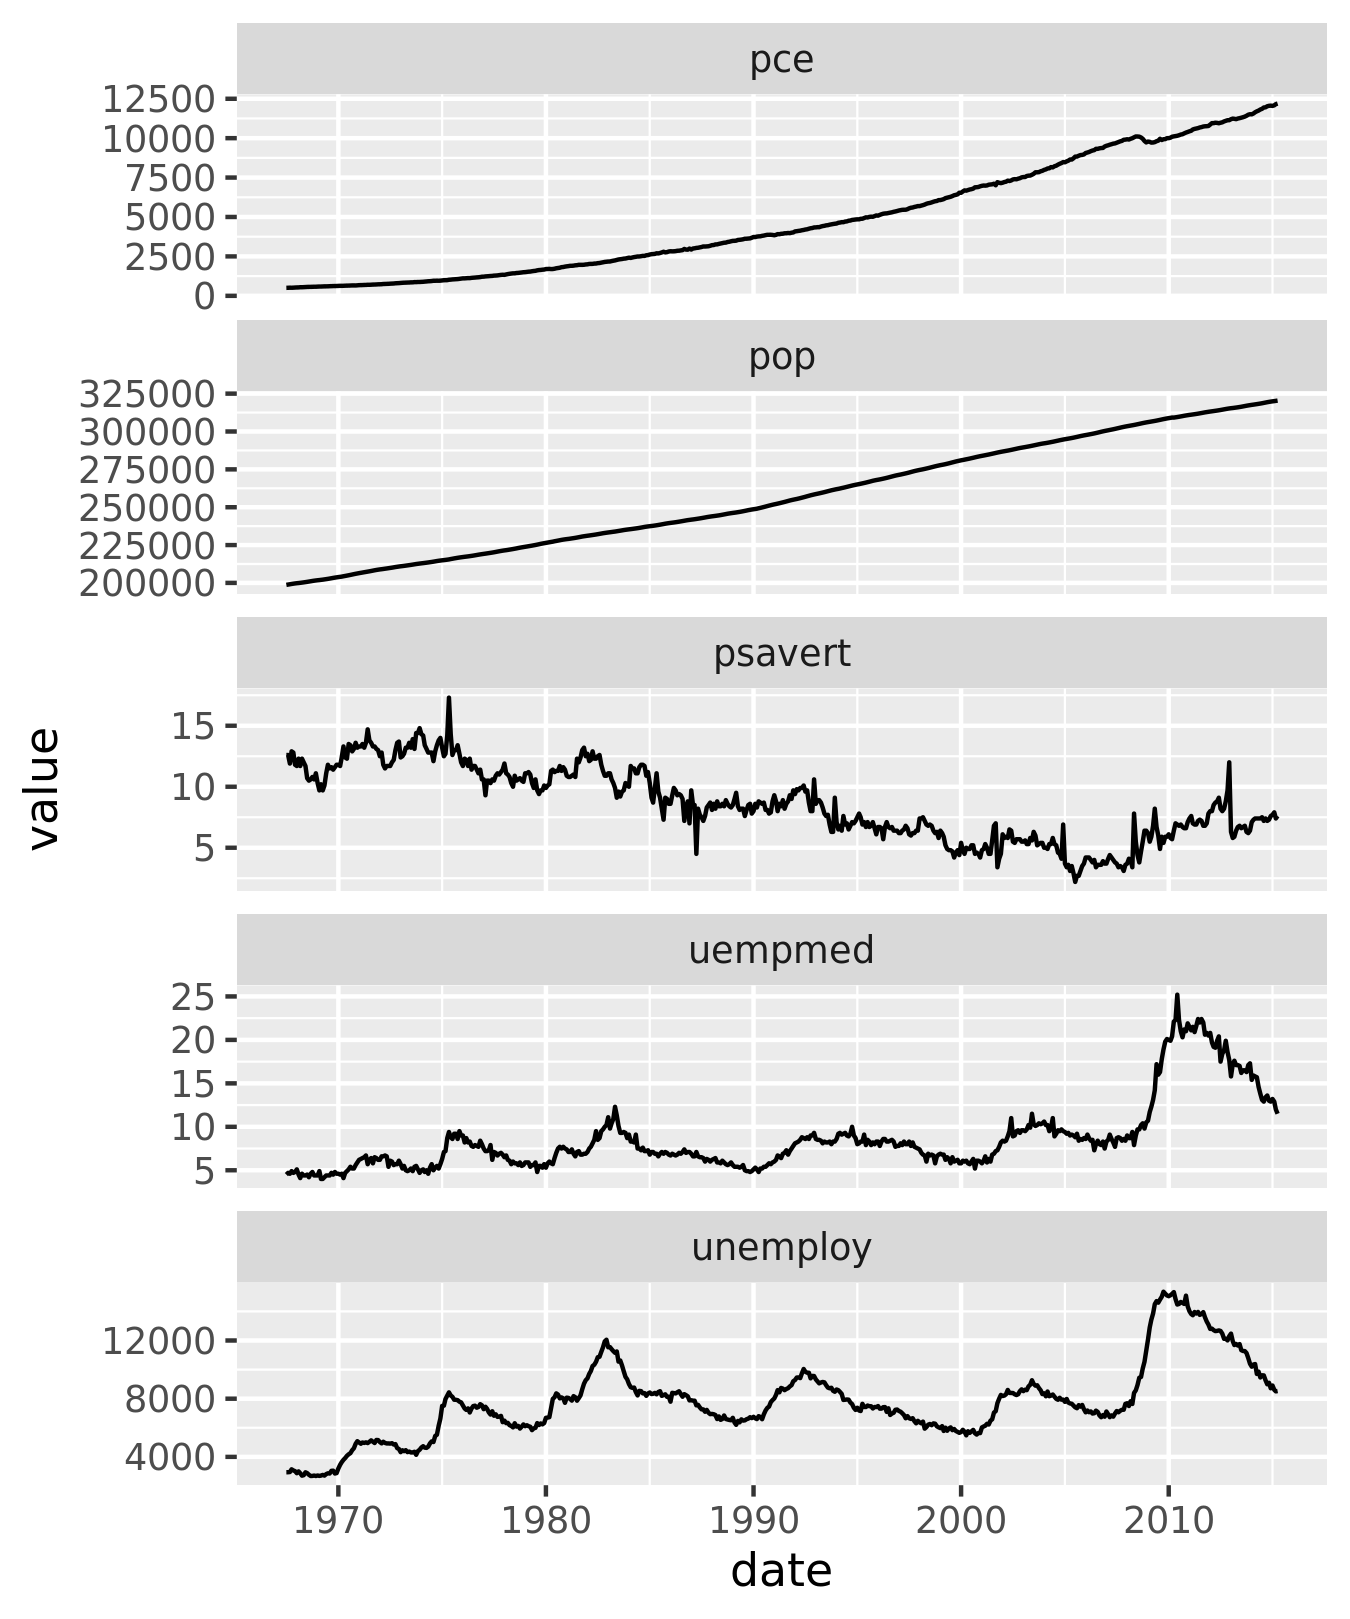
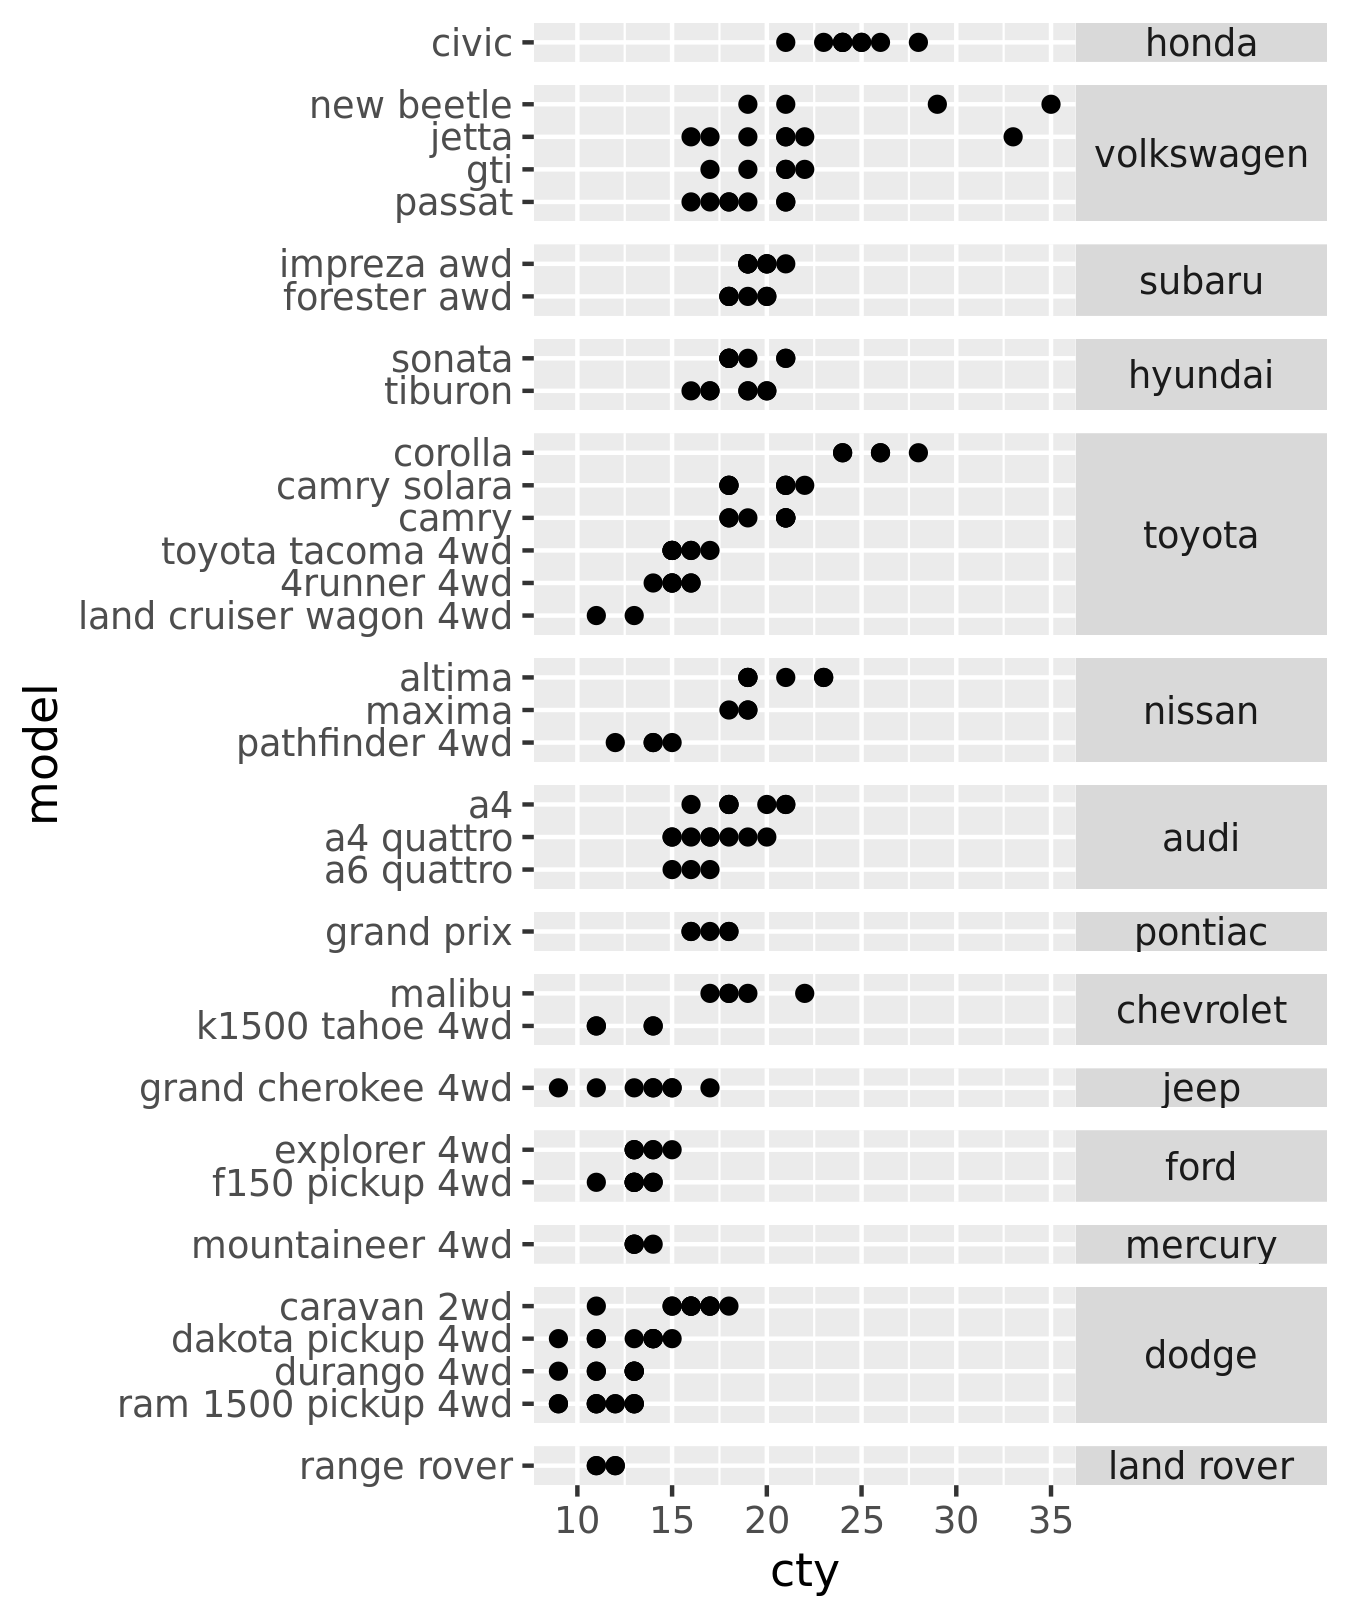
facet_grid() has an additional parameter called space, which takes the same values as scales. When space is “free”, each column (or row) will have width (or height) proportional to the range of the scale for that column (or row). This makes the scaling equal across the whole plot: 1 cm on each panel maps to the same range of data. (This is somewhat analogous to the ‘sliced’ axis limits of lattice.) For example, if panel a had range 2 and panel b had range 4, one-third of the space would be given to a, and two-thirds to b. This is most useful for categorical scales, where we can assign space proportionally based on the number of levels in each facet, as illustrated below.
mpg2$model <- reorder(mpg2$model, mpg2$cty)
mpg2$manufacturer <- reorder(mpg2$manufacturer, -mpg2$cty)
ggplot(mpg2, aes(cty, model)) +
  geom_point() +
  facet_grid(manufacturer ~ ., scales = "free", space = "free") +
  theme(strip.text.y = element_text(angle = 0))