9.2 Date-time
9.2.1 Breaks
A special case arises when an aesthetic is mapped to a date/time type: such as the base Date (for dates) and POSIXct (for date-times) classes, as well as the hms class for “time of day” values provided by the hms package.32 If your dates are in a different format you will need to convert them using as.Date(), as.POSIXct() or hms::as_hms(). You may also find the lubridate package helpful to manipulate date/time data.33
Assuming you have appropriately formatted data mapped to the x aesthetic, ggplot2 will use scale_x_date() as the default scale for dates and scale_x_datetime() as the default scale for date-time data. The corresponding scales for other aesthetics follow the usual naming rules. Date scales behave similarly to other continuous scales, but contain additional arguments that are allow you to work in date-friendly units. This section discusses breaks: controlling the labels for date scales is discussed in Section 9.2.4.
The date_breaks argument allows you to position breaks by date units (years, months, weeks, days, hours, minutes, and seconds). For example, date_breaks = "2 weeks" will place a major tick mark every two weeks and date_breaks = 25 years" will place them every 25 years:
date_base <- ggplot(economics, aes(date, psavert)) +
  geom_line(na.rm = TRUE) +
  labs(x = NULL, y = NULL)

date_base
date_base + scale_x_date(date_breaks = "25 years")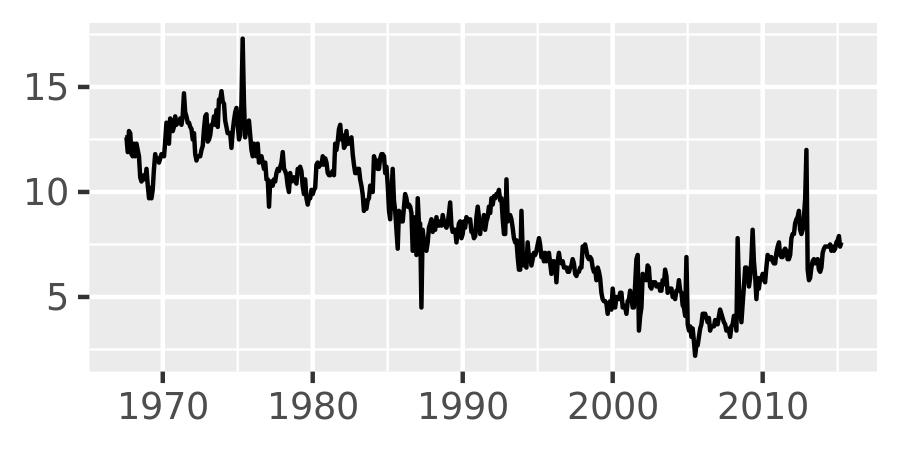

It may be useful to note that internally date_breaks = "25 years" is treated as a shortcut for breaks = scales::breaks_width("25 years"). The longer form is typically unnecessary, but it can be useful if—as discussed in Section 9.1.5—you wish to specify an offset. Suppose the goal is to plot data that span the 20th century, beginning 1 January 1900, and we wish to set breaks in 25 year intervals. Specifying date_breaks = "25 years" produces breaks in the following fashion:
century20 <- as.Date(c("1900-01-01", "1999-12-31"))
breaks <- scales::breaks_width("25 years")
breaks(century20)
#> [1] "1900-01-01" "1925-01-01" "1950-01-01" "1975-01-01" "2000-01-01"
Because the range in century20 starts on 1 January and the breaks increment in whole year values, each of the generated break dates falls on 1 January. We can shift all these breaks so that they fall on 1 February by setting offset = 31 (since there are thirty one days in January).
9.2.2 Minor breaks
For date/time scales, you can use the date_minor_breaks argument:
date_base + scale_x_date(
  limits = as.Date(c("2003-01-01", "2003-04-01")),
  date_breaks = "1 month"
)

date_base + scale_x_date(
  limits = as.Date(c("2003-01-01", "2003-04-01")),
  date_breaks = "1 month",
  date_minor_breaks = "1 week"
)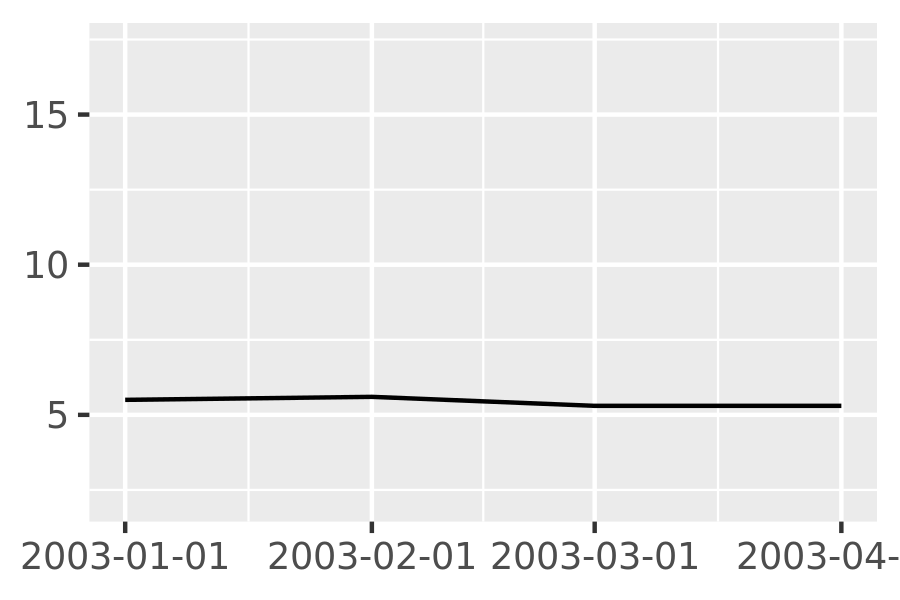
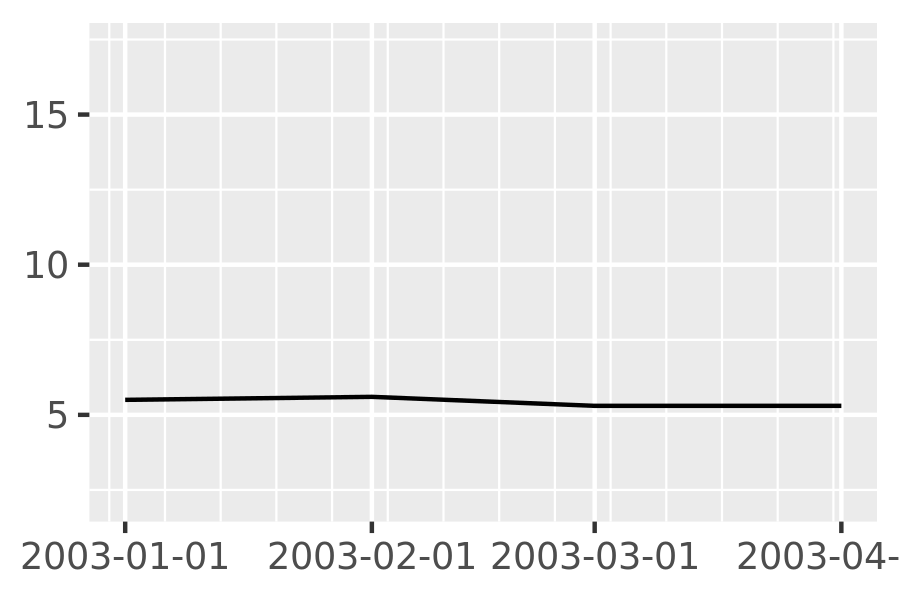
Note that in the first plot, the minor breaks are spaced evenly between the monthly major breaks. In the second plot, the major and minor beaks follow slightly different patterns: the minor breaks are always spaced 7 days apart but the major breaks are 1 month apart. Because the months vary in length, this leads to slightly uneven spacing.
9.2.3 Labels
9.2.4 Date scale labels
Like date_breaks, date scales include a date_labels argument. It controls the display of the labels using the same formatting strings as in strptime() and format(). To display dates like 14/10/1979, for example, you would use the string "%d/%m/%Y": in this expression %d produces a numeric day of month, %m produces a numeric month, and %Y produces a four digit year. The table below provides a list of formatting strings:
| String | Meaning |
|---|---|
%S |
second (00-59) |
%M |
minute (00-59) |
%l |
hour, in 12-hour clock (1-12) |
%I |
hour, in 12-hour clock (01-12) |
%p |
am/pm |
%H |
hour, in 24-hour clock (00-23) |
%a |
day of week, abbreviated (Mon-Sun) |
%A |
day of week, full (Monday-Sunday) |
%e |
day of month (1-31) |
%d |
day of month (01-31) |
%m |
month, numeric (01-12) |
%b |
month, abbreviated (Jan-Dec) |
%B |
month, full (January-December) |
%y |
year, without century (00-99) |
%Y |
year, with century (0000-9999) |
One useful scenario for date label formatting is when there’s insufficient room to specify a four digit year. Using %y ensures that only the last two digits are displayed:
base <- ggplot(economics, aes(date, psavert)) +
  geom_line(na.rm = TRUE) +
  labs(x = NULL, y = NULL)

base + scale_x_date(date_breaks = "5 years")
base + scale_x_date(date_breaks = "5 years", date_labels = "%y")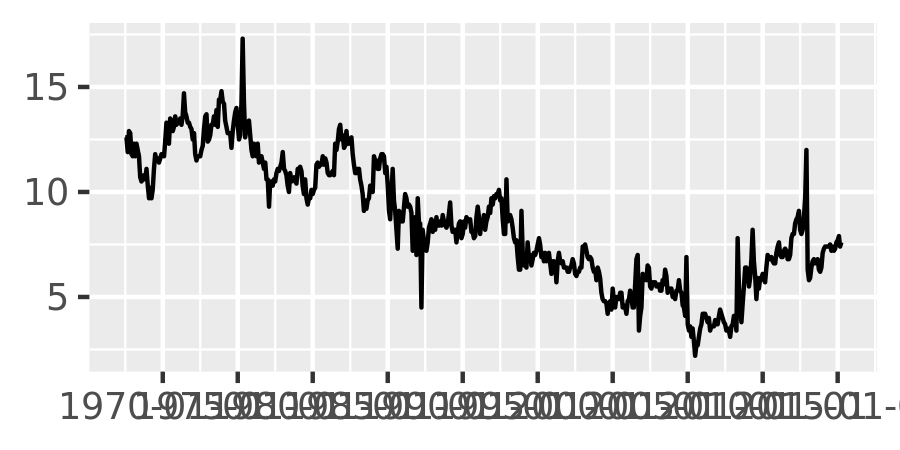

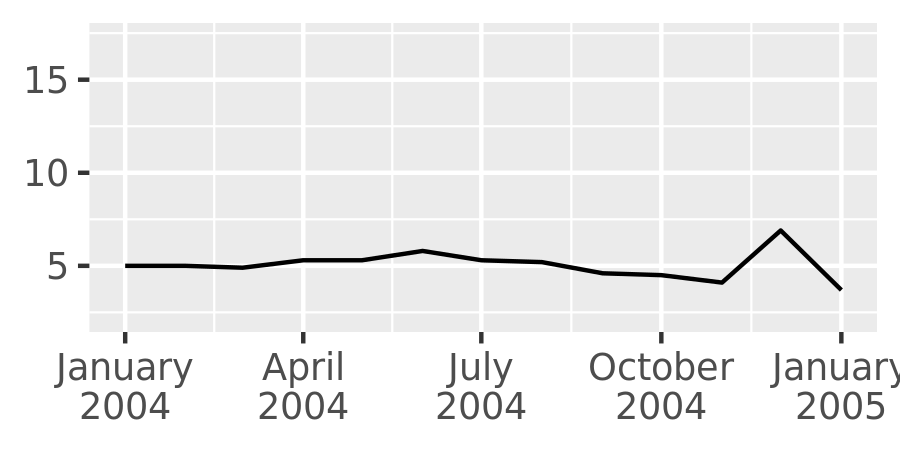
It can be useful to include the line break character \n in a formatting string, particularly when full-length month names are included:
lim <- as.Date(c("2004-01-01", "2005-01-01"))

base + scale_x_date(limits = lim, date_labels = "%b %y")
base + scale_x_date(limits = lim, date_labels = "%B\n%Y")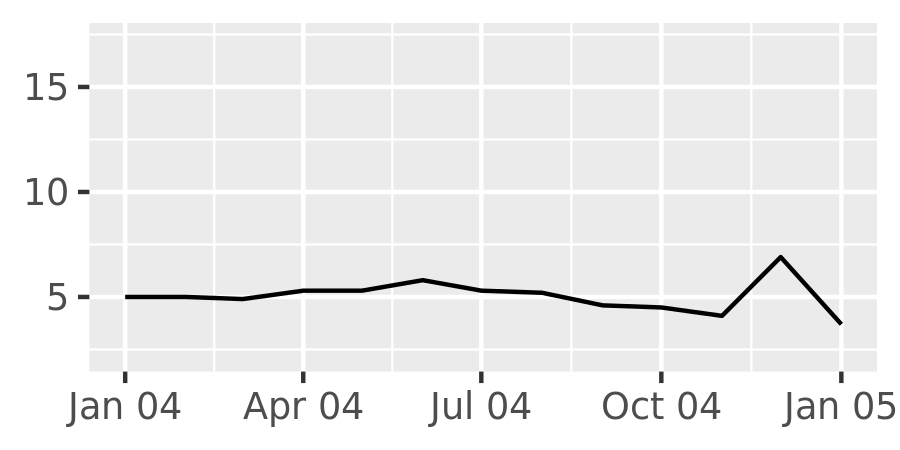
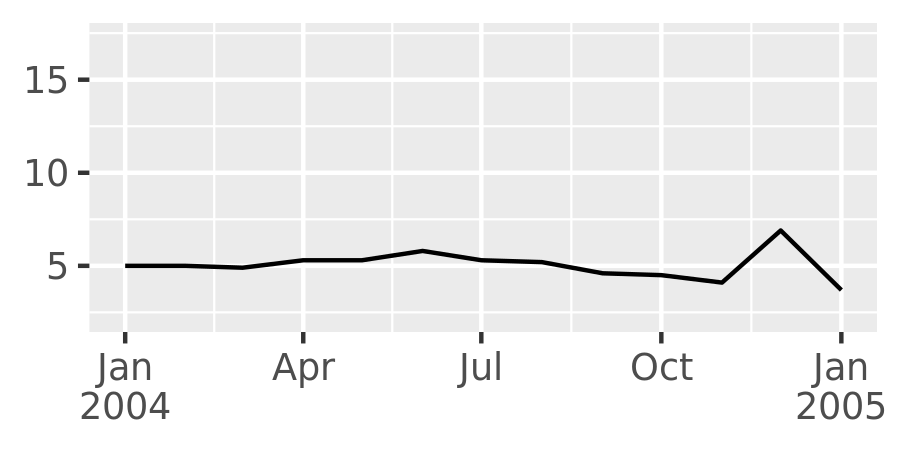
In these examples I have specified the labels manually via the date_labels argument. An alternative approach is to pass a labelling function to the labels argument, in the same way I described in Section ??. The scales package provides two convenient functions that will generate date labellers for you:
label_date()is whatdate_labelsdoes for you behind the scenes, so you rarely need to call it directly.label_date_short()automatically constructs short labels that are sufficient to uniquely identify the dates:base + scale_x_date(labels = scales::label_date("%b %y")) base + scale_x_date(limits = lim, labels = scales::label_date_short())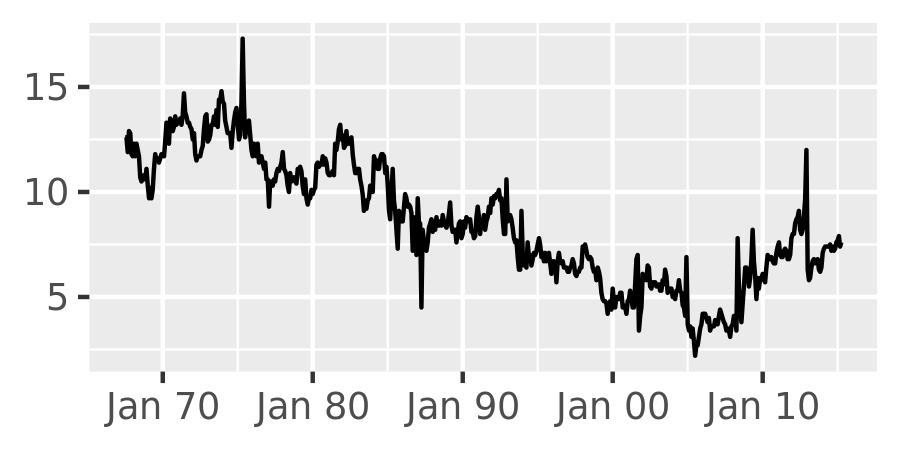
Kirill Müller, Hms: Pretty Time of Day, 2020, https://CRAN.R-project.org/package=hms.↩︎
Garrett Grolemund and Hadley Wickham, “Dates and Times Made Easy with lubridate,” Journal of Statistical Software 40, no. 3 (2011): 1–25, http://www.jstatsoft.org/v40/i03/.↩︎