5.3 Diamonds data
To demonstrate tools for large datasets, we’ll use the built in diamonds dataset, which consists of price and quality information for ~54,000 diamonds:
diamonds
#> # A tibble: 53,940 x 10
#>   carat cut       color clarity depth table price     x     y     z
#>   <dbl> <ord>     <ord> <ord>   <dbl> <dbl> <int> <dbl> <dbl> <dbl>
#> 1 0.23  Ideal     E     SI2      61.5    55   326  3.95  3.98  2.43
#> 2 0.21  Premium   E     SI1      59.8    61   326  3.89  3.84  2.31
#> 3 0.23  Good      E     VS1      56.9    65   327  4.05  4.07  2.31
#> 4 0.290 Premium   I     VS2      62.4    58   334  4.2   4.23  2.63
#> 5 0.31  Good      J     SI2      63.3    58   335  4.34  4.35  2.75
#> 6 0.24  Very Good J     VVS2     62.8    57   336  3.94  3.96  2.48
#> # … with 53,934 more rows
The data contains the four C’s of diamond quality: carat, cut, colour and clarity; and five physical measurements: depth, table, x, y and z, as described in Figure 5.1.
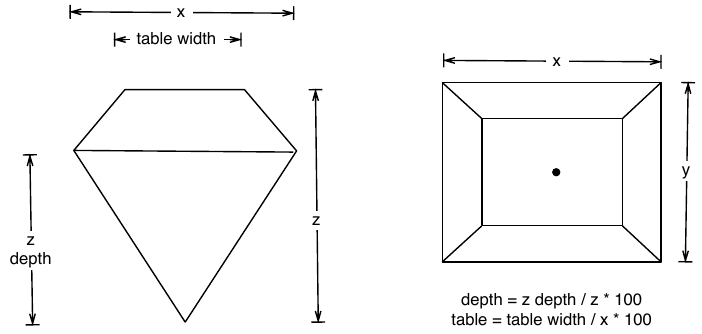
Figure 5.1: How the variables x, y, z, table and depth are measured.
The dataset has not been well cleaned, so as well as demonstrating interesting facts about diamonds, it also shows some data quality problems.