16.7 Exercises
Diamonds: display the distribution of price conditional on cut and carat. Try faceting by cut and grouping by carat. Try faceting by carat and grouping by cut. Which do you prefer?
Diamonds: compare the relationship between price and carat for each colour. What makes it hard to compare the groups? Is grouping better or faceting? If you use faceting, what annotation might you add to make it easier to see the differences between panels?
Why is
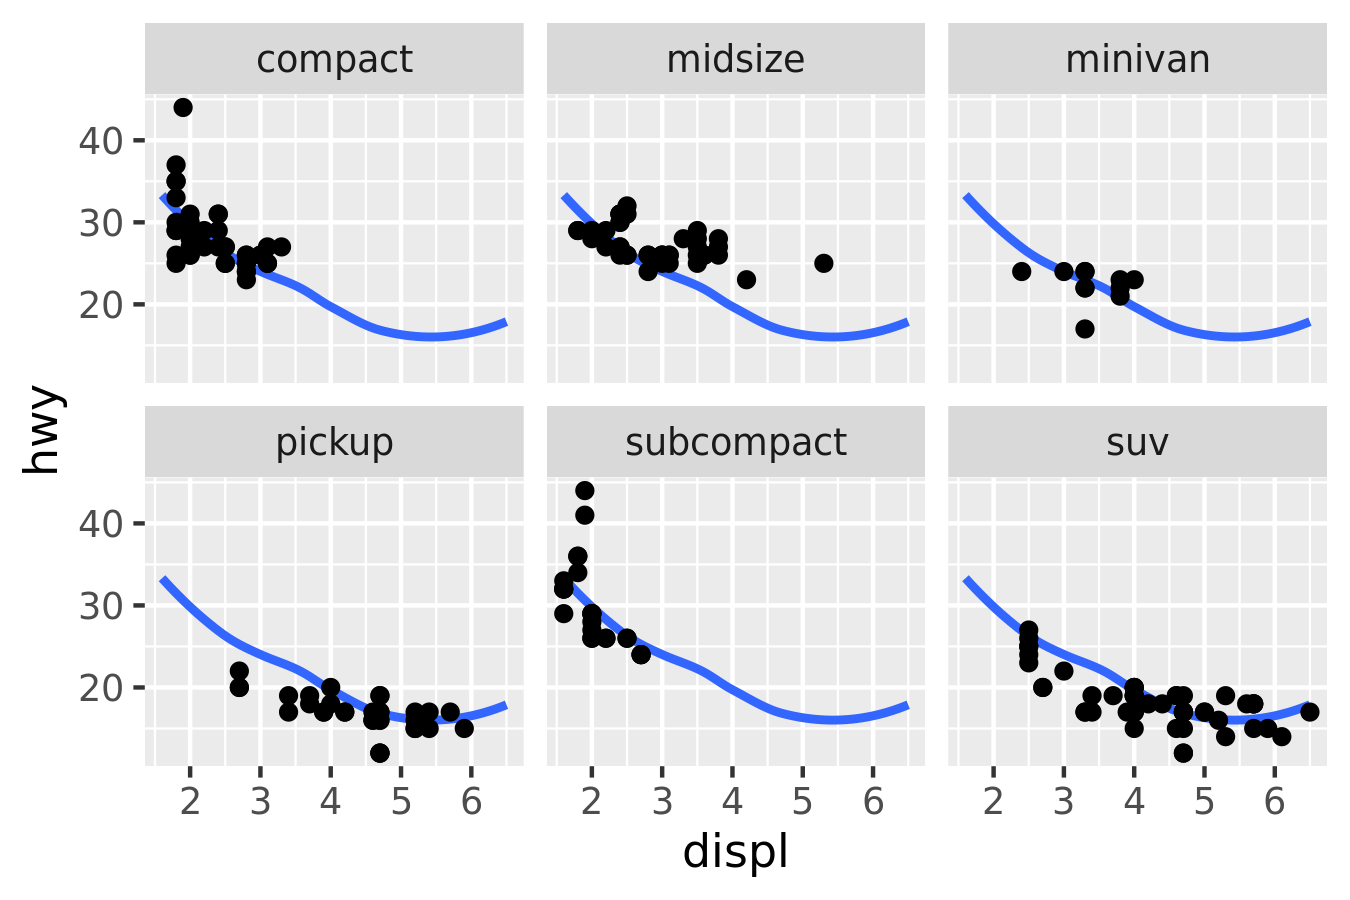
facet_wrap()generally more useful thanfacet_grid()?Recreate the following plot. It facets
mpg2by class, overlaying a smooth curve fit to the full dataset.#> `geom_smooth()` using method = 'loess' and formula 'y ~ x'