16.1 Facet wrap
facet_wrap() makes a long ribbon of panels (generated by any number of variables) and wraps it into 2d. This is useful if you have a single variable with many levels and want to arrange the plots in a more space efficient manner.
You can control how the ribbon is wrapped into a grid with ncol, nrow, as.table and dir. ncol and nrow control how many columns and rows (you only need to set one). as.table controls whether the facets are laid out like a table (TRUE), with highest values at the bottom-right, or a plot (FALSE), with the highest values at the top-right. dir controls the direction of wrap: horizontal or vertical.
base <- ggplot(mpg2, aes(displ, hwy)) +
geom_blank() +
xlab(NULL) +
ylab(NULL)
base + facet_wrap(~class, ncol = 3)
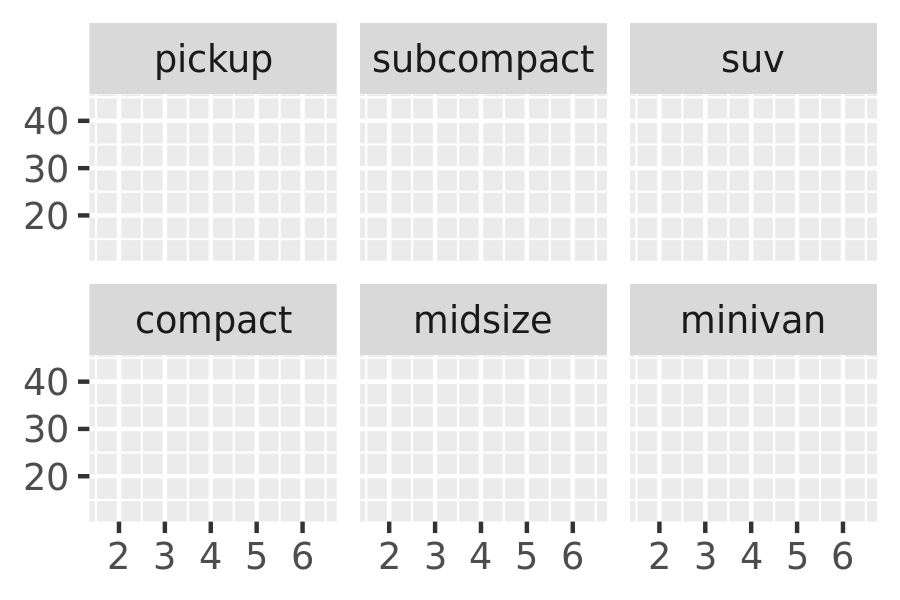
base + facet_wrap(~class, ncol = 3, as.table = FALSE)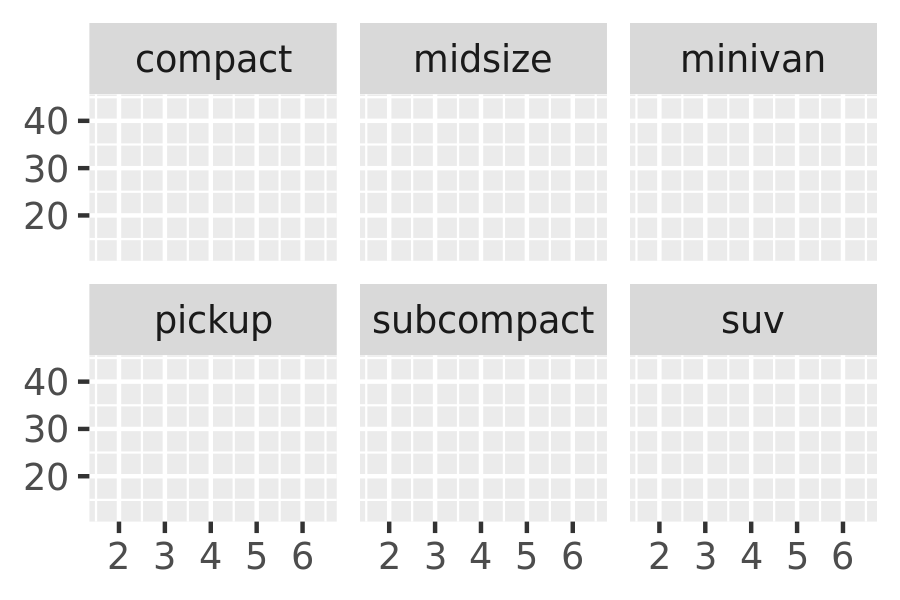
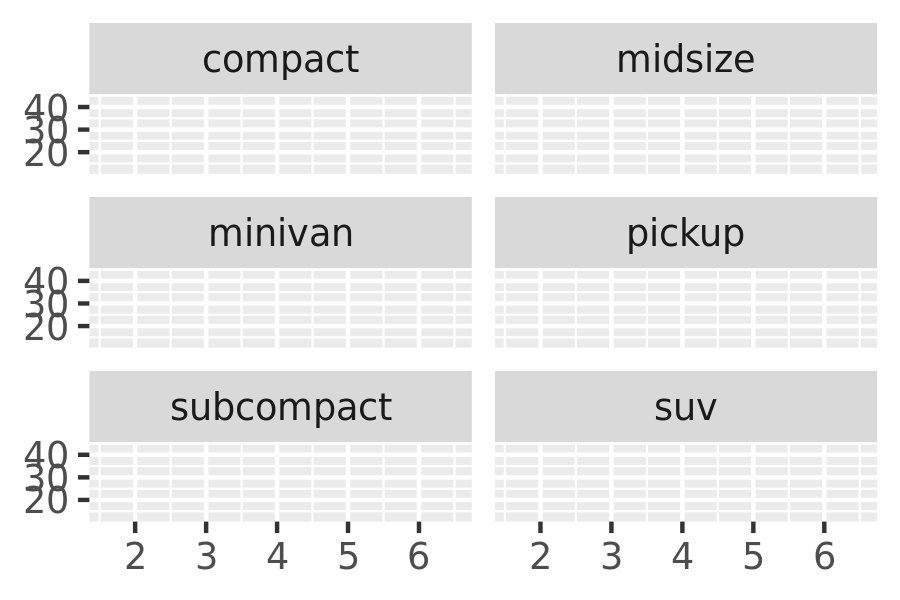
base + facet_wrap(~class, nrow = 3)
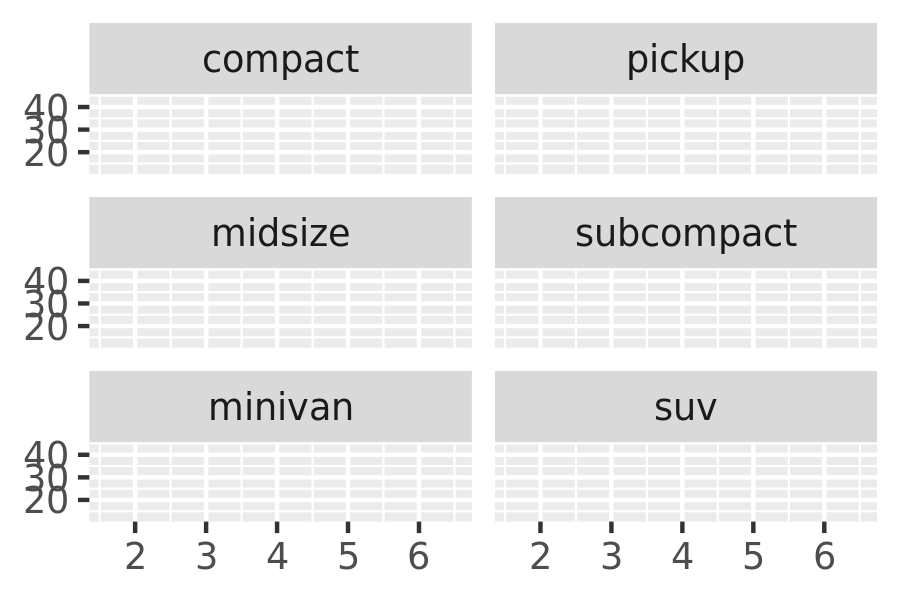
base + facet_wrap(~class, nrow = 3, dir = "v")