18.5 Functional programming
Since ggplot2 objects are just regular R objects, you can put them in a list. This means you can apply all of R’s great functional programming tools. For example, if you wanted to add different geoms to the same base plot, you could put them in a list and use lapply().
geoms <- list(
geom_point(),
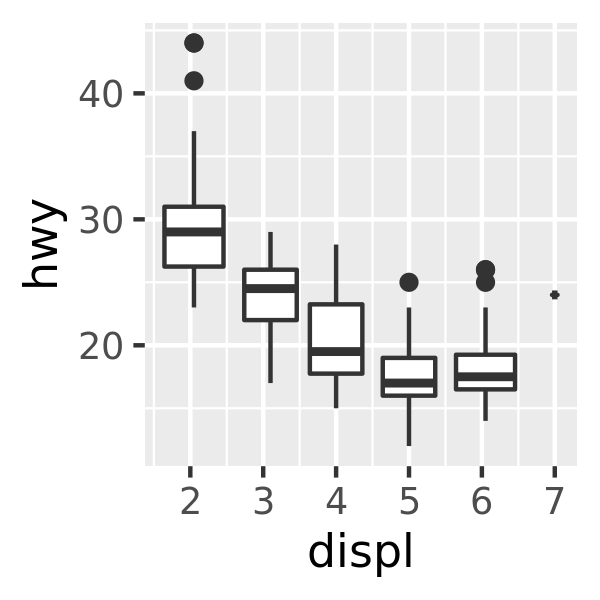
geom_boxplot(aes(group = cut_width(displ, 1))),
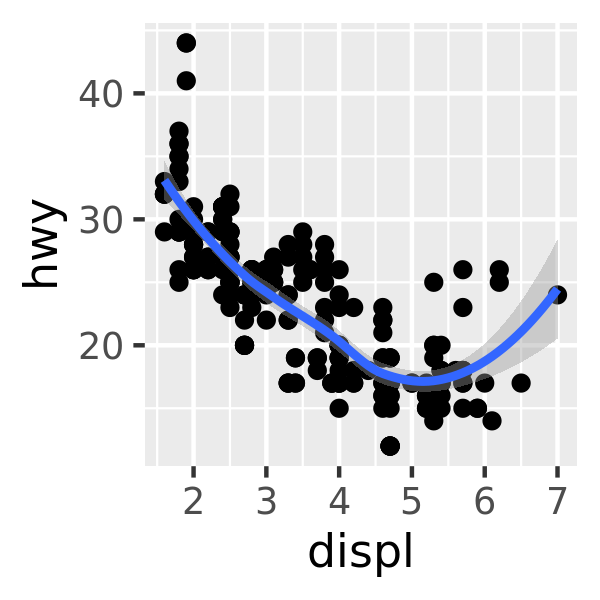
list(geom_point(), geom_smooth())
)
p <- ggplot(mpg, aes(displ, hwy))
lapply(geoms, function(g) p + g)
#> [[1]]
#>
#> [[2]]
#>
#> [[3]]
#> `geom_smooth()` using method = 'loess' and formula 'y ~ x'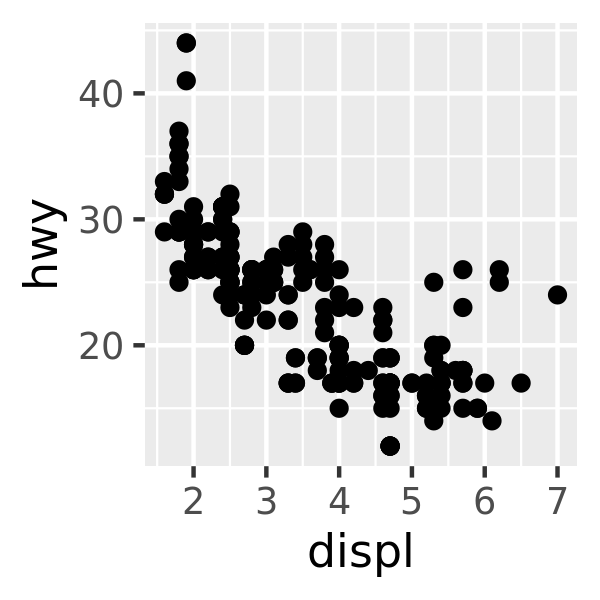
If you’re not familiar with functional programming, read through http://adv-r.had.co.nz/Functional-programming.html and think about how you might apply the techniques to your duplicated plotting code.
18.5.1 Exercises
How could you add a
geom_point()layer to each element of the following list?plots <- list( ggplot(mpg, aes(displ, hwy)), ggplot(diamonds, aes(carat, price)), ggplot(faithfuld, aes(waiting, eruptions, size = density)) )What does the following function do? What’s a better name for it?
mystery <- function(...) {
  Reduce(`+`, list(...), accumulate = TRUE)
}

mystery(
  ggplot(mpg, aes(displ, hwy)) + geom_point(),
  geom_smooth(),
  xlab(NULL),
  ylab(NULL)
)