11.5 Identity scales
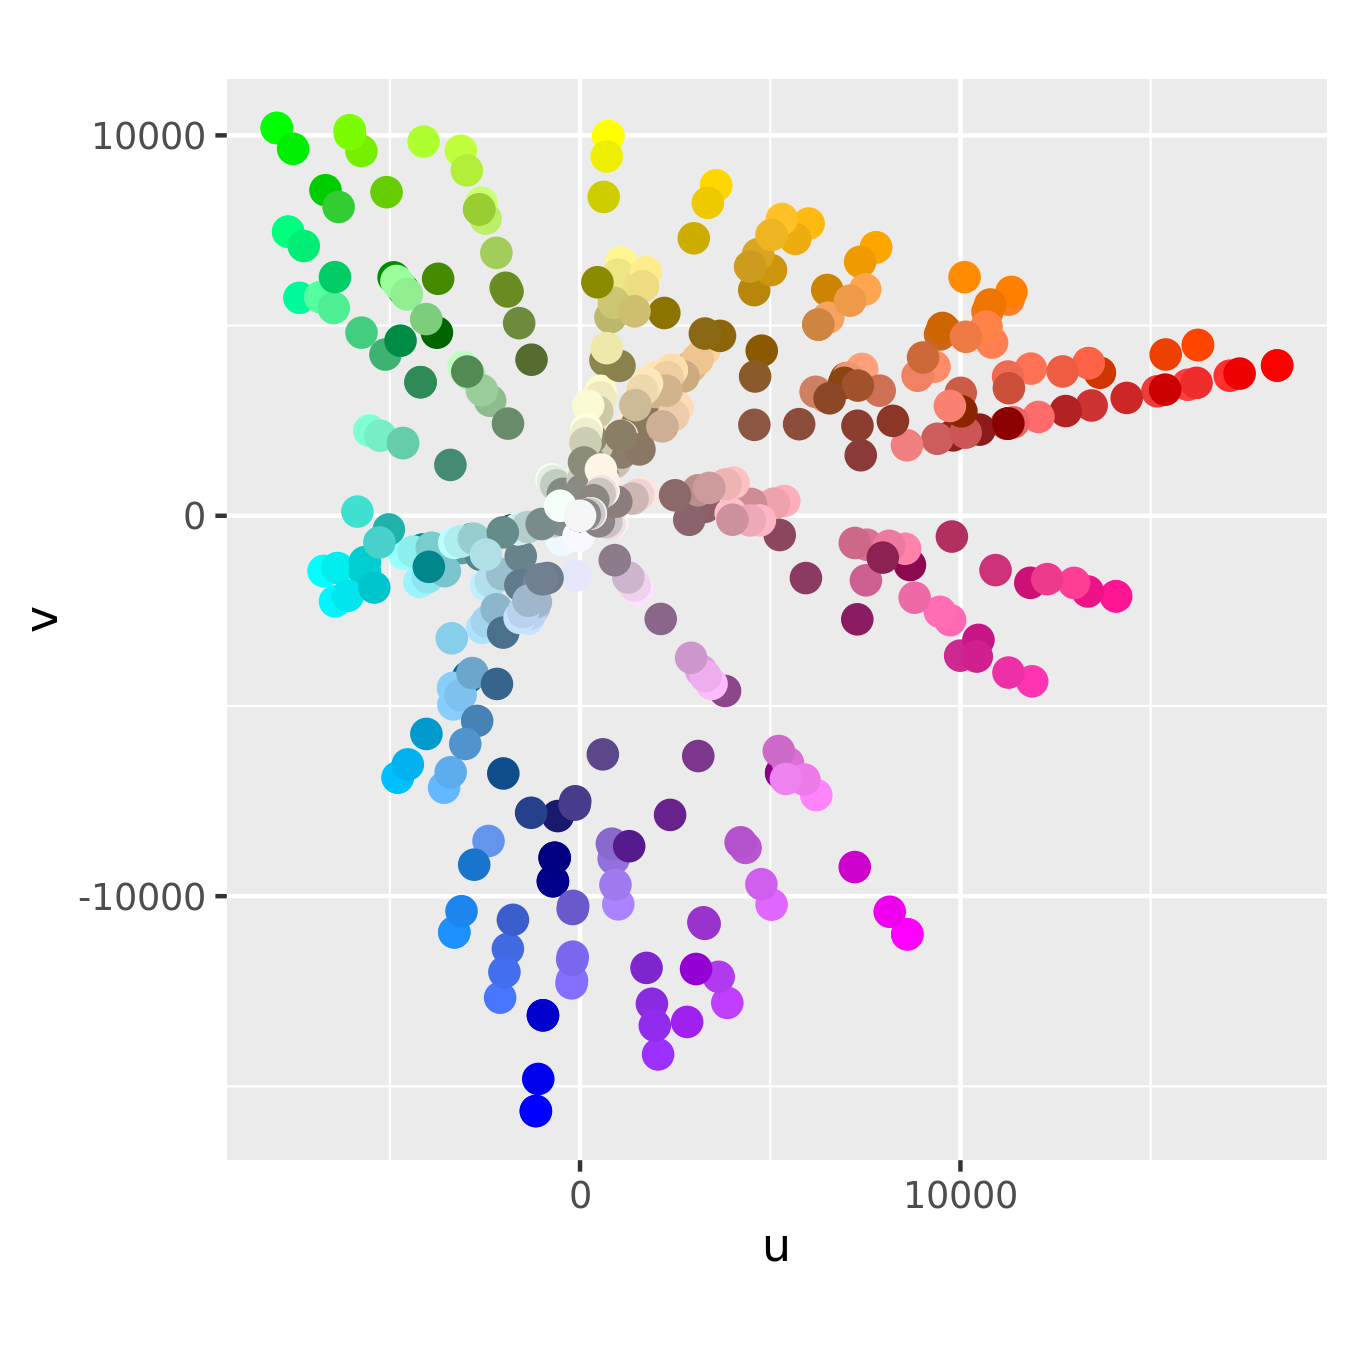
Identity scales — such as scale_colour_identity() and scale_shape_identity() — are used when your data is already scaled such that the data and aesthetic spaces are the same. The code below shows an example where the identity scale is useful. luv_colours contains the locations of all R’s built-in colours in the LUV colour space (the space that HCL is based on). A legend is unnecessary, because the point colour represents itself: the data and aesthetic spaces are the same.
head(luv_colours)
#>      L         u    v           col
#> 1 9342 -3.37e-12    0         white
#> 2 9101 -4.75e+02 -635     aliceblue
#> 3 8810  1.01e+03 1668  antiquewhite
#> 4 8935  1.07e+03 1675 antiquewhite1
#> 5 8452  1.01e+03 1610 antiquewhite2
#> 6 7498  9.03e+02 1402 antiquewhite3

ggplot(luv_colours, aes(u, v)) +
geom_point(aes(colour = col), size = 3) +
scale_color_identity() +
coord_equal()