4.1 Multiple groups, one aesthetic
In many situations, you want to separate your data into groups, but render them in the same way. In other words, you want to be able to distinguish individual subjects, but not identify them. This is common in longitudinal studies with many subjects, where the plots are often descriptively called spaghetti plots. For example, the following plot shows the growth trajectory for each boy (each Subject):
ggplot(Oxboys, aes(age, height, group = Subject)) +
  geom_point() +
  geom_line()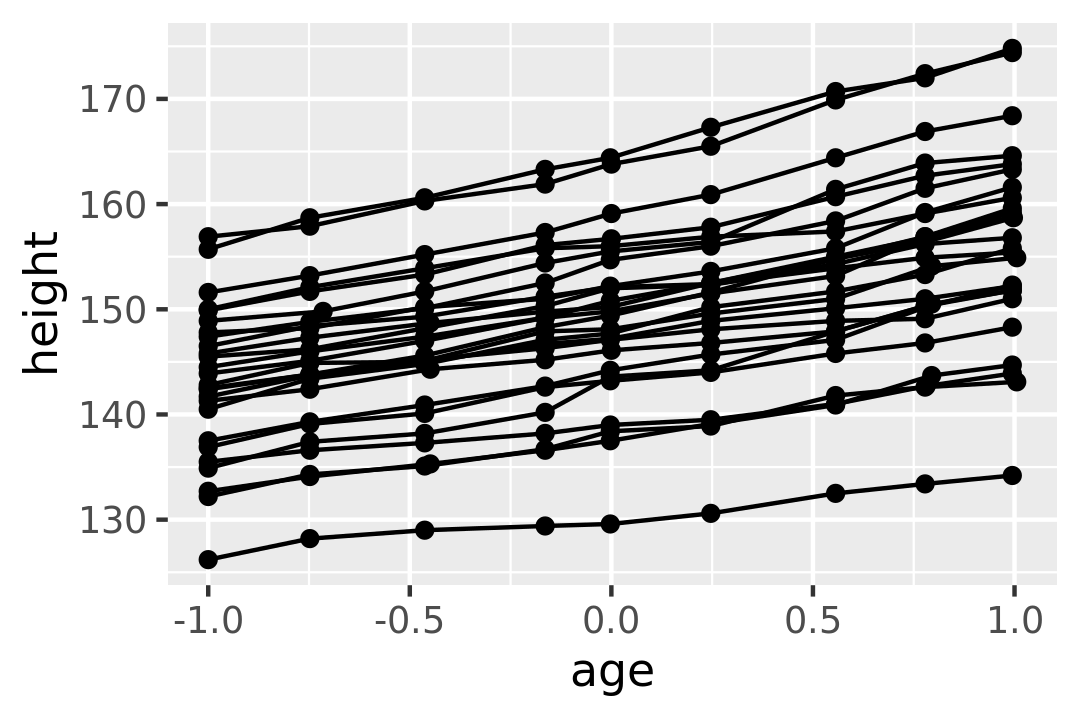
If you incorrectly specify the grouping variable, you’ll get a characteristic sawtooth appearance:
ggplot(Oxboys, aes(age, height)) +
  geom_point() +
  geom_line()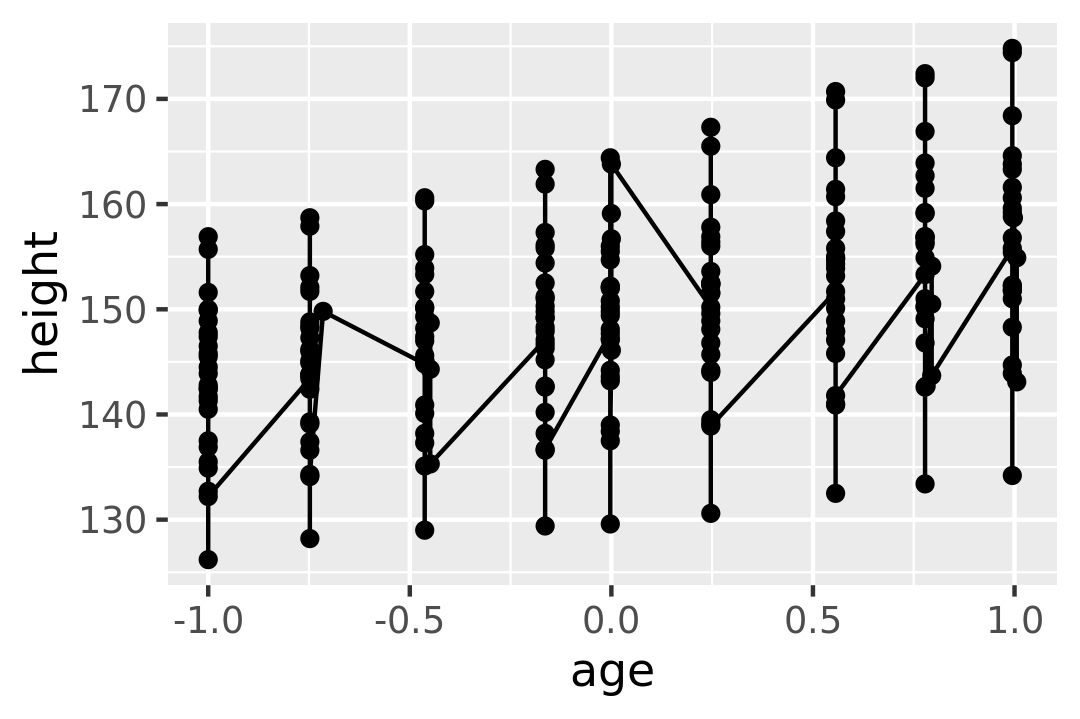
If a group isn’t defined by a single variable, but instead by a combination of multiple variables, use interaction() to combine them, e.g. aes(group = interaction(school_id, student_id)).