4.3 Overriding the default grouping
Some plots have a discrete x scale, but you still want to draw lines connecting across groups. This is the strategy used in interaction plots, profile plots, and parallel coordinate plots, among others. For example, imagine we’ve drawn boxplots of height at each measurement occasion:
ggplot(Oxboys, aes(Occasion, height)) +
  geom_boxplot()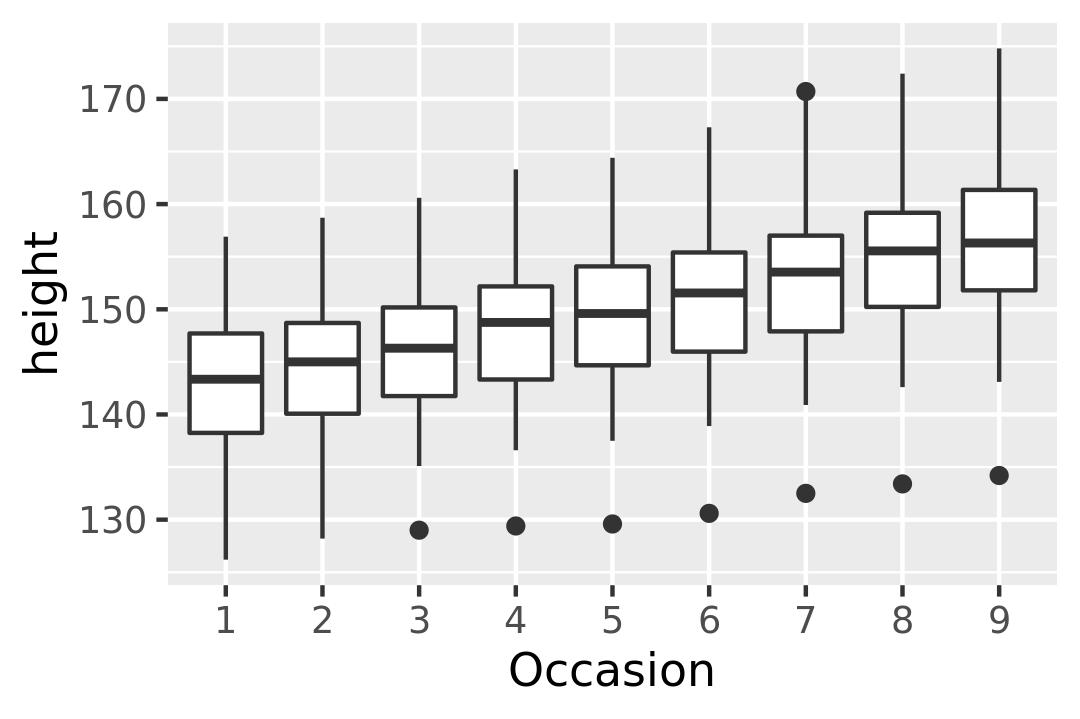
There is one discrete variable in this plot, Occasion, so we get one boxplot for each unique x value. Now we want to overlay lines that connect each individual boy. Simply adding geom_line() does not work: the lines are drawn within each occassion, not across each subject:
ggplot(Oxboys, aes(Occasion, height)) +
  geom_boxplot() +
  geom_line(colour = "#3366FF", alpha = 0.5)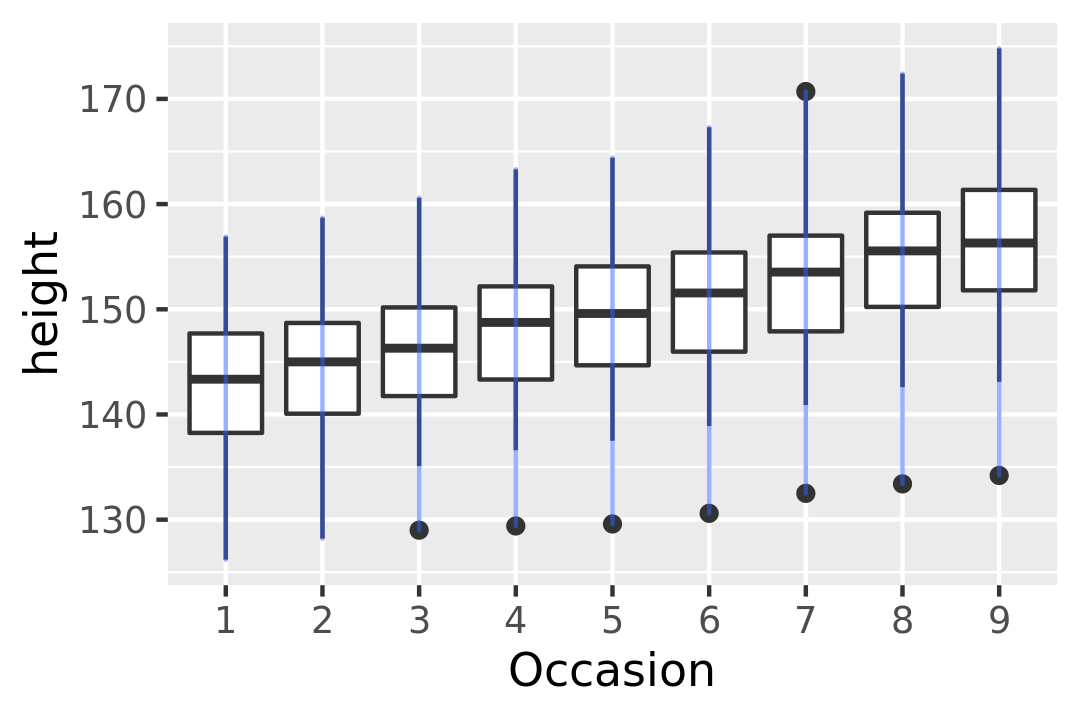
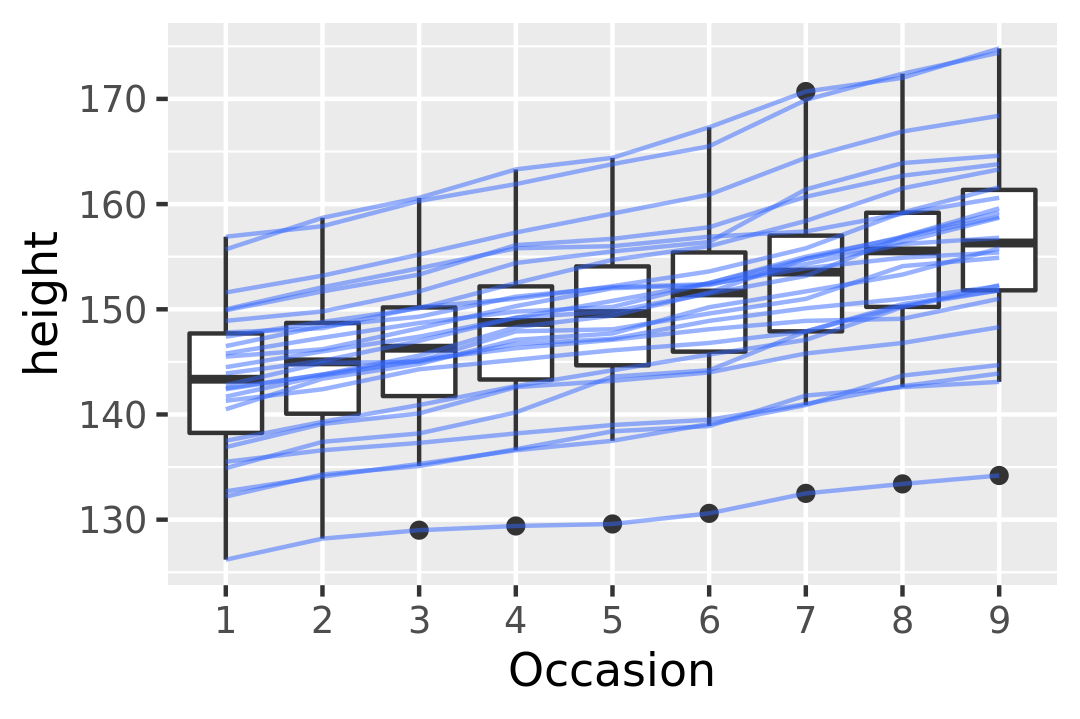
To get the plot we want, we need to override the grouping to say we want one line per boy:
ggplot(Oxboys, aes(Occasion, height)) +
  geom_boxplot() +
  geom_line(aes(group = Subject), colour = "#3366FF", alpha = 0.5)