17.5 Saving your output
When saving a plot to use in another program, you have two basic choices of output: raster or vector:
Vector graphics describe a plot as sequence of operations: draw a line from \((x_1, y_1)\) to \((x_2, y_2)\), draw a circle at \((x_3, x_4)\) with radius \(r\). This means that they are effectively ‘infinitely’ zoomable; there is no loss of detail. The most useful vector graphic formats are pdf and svg.
Raster graphics are stored as an array of pixel colours and have a fixed optimal viewing size. The most useful raster graphic format is png.
Figure 17.1 illustrates the basic differences in these formats for a circle. A good description is available at http://tinyurl.com/rstrvctr.
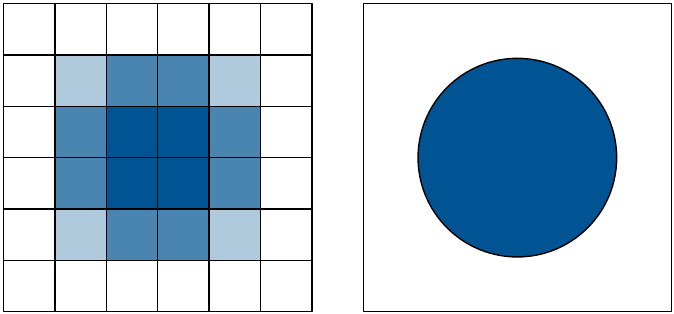
Figure 17.1: The schematic difference between raster (left) and vector (right) graphics.
Unless there is a compelling reason not to, use vector graphics: they look better in more places. There are two main reasons to use raster graphics:
You have a plot (e.g. a scatterplot) with thousands of graphical objects (i.e. points). A vector version will be large and slow to render.
You want to embed the graphic in MS Office. MS has poor support for vector graphics (except for their own DrawingXML format which is not currently easy to make from R), so raster graphics are easier.
There are two ways to save output from ggplot2. You can use the standard R approach where you open a graphics device, generate the plot, then close the device:
pdf("output.pdf", width = 6, height = 6)
ggplot(mpg, aes(displ, cty)) + geom_point()
dev.off()
This works for all packages, but is verbose. ggplot2 provides a convenient shorthand with ggsave():
ggplot(mpg, aes(displ, cty)) + geom_point()
ggsave("output.pdf")
ggsave() is optimised for interactive use: you can use it after you’ve drawn a plot. It has the following important arguments:
The first argument,
path, specifies the path where the image should be saved. The file extension will be used to automatically select the correct graphics device.ggsave()can produce.eps,.pdf,.svg,.wmf,.png,.jpg,.bmp, and.tiff.widthandheightcontrol the output size, specified in inches. If left blank, they’ll use the size of the on-screen graphics device.For raster graphics (i.e.
.png,.jpg), thedpiargument controls the resolution of the plot. It defaults to 300, which is appropriate for most printers, but you may want to use 600 for particularly high-resolution output, or 96 for on-screen (e.g., web) display.
See ?ggsave for more details.