14.3 Scale guides
In ggplot2, legend and axes are known collectively as guides. You might find it surprising that axes and legends are the same type of thing, but while they look very different they have the same purpose: to allow you to read observations from the plot and map them back to their original values.
| Argument name | Axis | Legend |
|---|---|---|
name |
Label | Title |
breaks |
Ticks & grid line | Key |
labels |
Tick label | Key label |
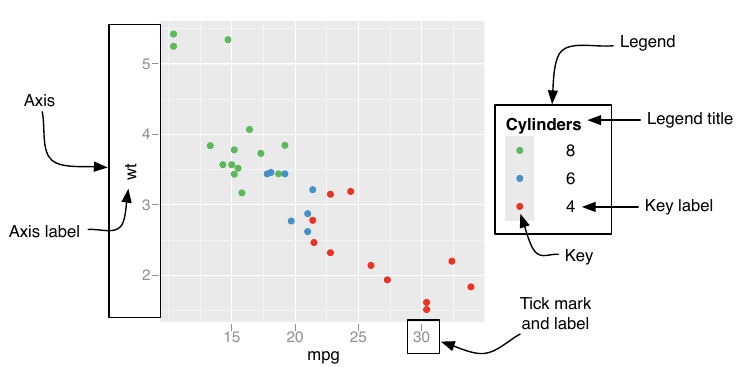
Figure 14.1: Common components of axes and legends
Later parts of the chapter focuses mostly on legends because they are more complicated than axes:
A legend can display multiple aesthetics (e.g. colour and shape), from multiple layers, and the symbol displayed in a legend varies based on the geom used in the layer.
Axes always appear in the same place. Legends can appear in different places, so you need some global way of controlling them.
Legends have considerably more details that can be tweaked: should they be displayed vertically or horizontally? How many columns? How big should the keys be?
Reflecting this additional complexity, Section 14.3 discusses guide functions, most of which relate to legends. Section 14.5 discusses how legends are split and merged across layers, Section 10.6.1 focuses on legend layout and positioning, while Section 10.7 shows you how to modify the glyphs displayed in the legend key.