8.4 Scale names
A common task when creating plots is to customise the title of the axes and legends. To illustrate how this is done, I’ll create a small toy data frame that I will reuse throughout the chapter:
toy <- data.frame(
const = 1,
up = 1:4,
txt = letters[1:4],
big = (1:4)*1000,
log = c(2, 5, 10, 2000)
)
toy
#> const up txt big log
#> 1 1 1 a 1000 2
#> 2 1 2 b 2000 5
#> 3 1 3 c 3000 10
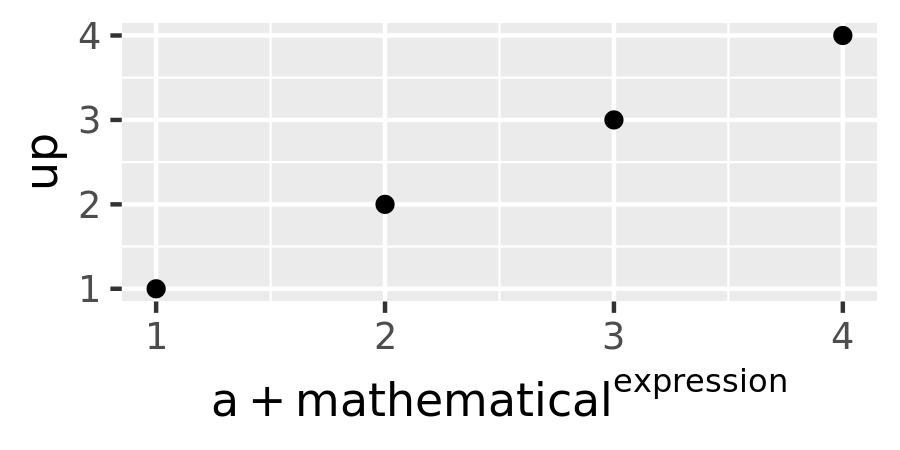
#> 4 1 4 d 4000 2000The axis or legend title is specified by name, which is always the first argument to the scale function. Usually this argument takes a text string as input, using \n to specify line breaks, but you can supply mathematical expressions wrapped quote(), as described in ?plotmath
base <- ggplot(toy, aes(up, up)) + geom_point()

base + scale_x_continuous("X axis")
base + scale_x_continuous(quote(a + mathematical ^ expression))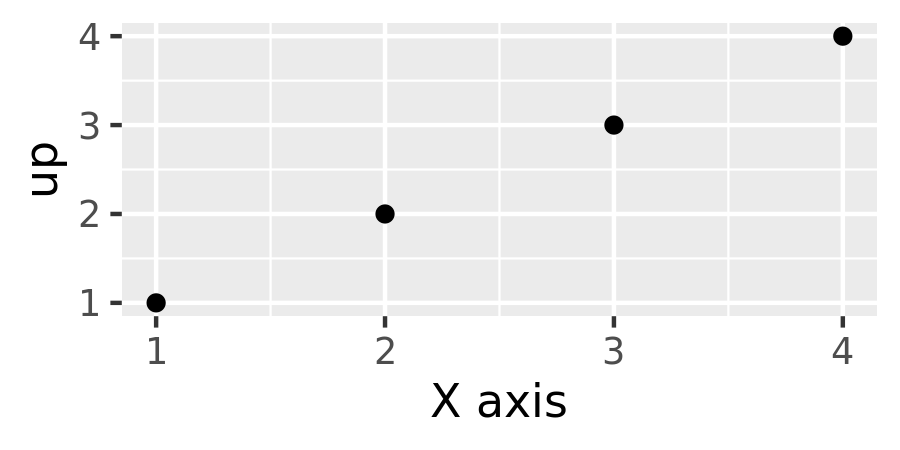
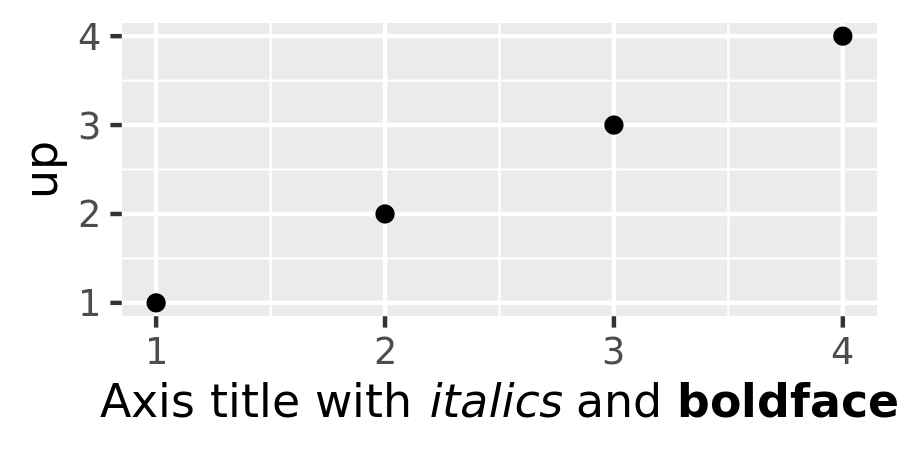
It is also possible to include (some) markdown in axis and legend titles with the help of the ggtext package30 and the ggplot2 theme system (see Chapter 17). To enable markdown you need to set the relevant theme element to ggtext::element_markdown(), as demonstrated below:
base <- ggplot(toy, aes(up, up)) +
  geom_point() +
  scale_x_continuous("Axis title with *italics* and **boldface**")

base
base + theme(axis.title.x = ggtext::element_markdown())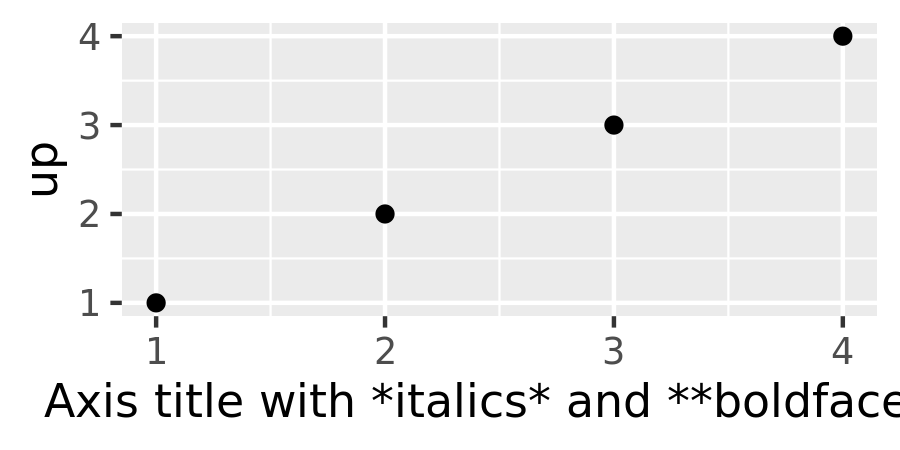
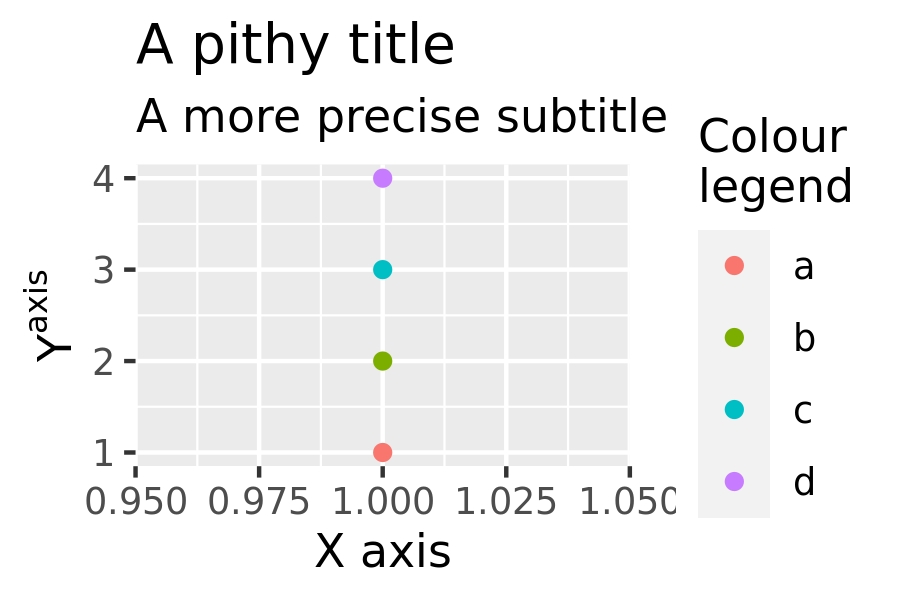
Because tweaking axis and legend labels is such a common task, ggplot2 provides the labs() helper function that saves you some typing. It allows you to set the name for one or more scales, using name-value pairs like x = "X axis" or fill = "fill legend". It also allows you to specify other plot labels, like titles, subtitles, captions and tags (see Section 7.1):
ggplot(toy, aes(const, up)) +
  geom_point(aes(colour = txt)) +
  labs(
    x = "X axis",
    y = quote(Y^axis),
    colour = "Colour\nlegend",
    title = "A pithy title",
    subtitle = "A more precise subtitle"
  )
There are two ways to remove the axis label. Setting labs(x = "") omits the label but still allocates space; setting labs(x = NULL) removes the label and its space.
Claus O. Wilke, Ggtext: Improved Text Rendering Support for ’Ggplot2’, 2020, https://CRAN.R-project.org/package=ggtext.↩︎