18.2 Single components
Each component of a ggplot plot is an object. Most of the time you create the component and immediately add it to a plot, but you don’t have to. Instead, you can save any component to a variable (giving it a name), and then add it to multiple plots:
bestfit <- geom_smooth(
method = "lm",
se = FALSE,
colour = alpha("steelblue", 0.5),
size = 2
)
ggplot(mpg, aes(cty, hwy)) +
geom_point() +
bestfit
#> `geom_smooth()` using formula 'y ~ x'
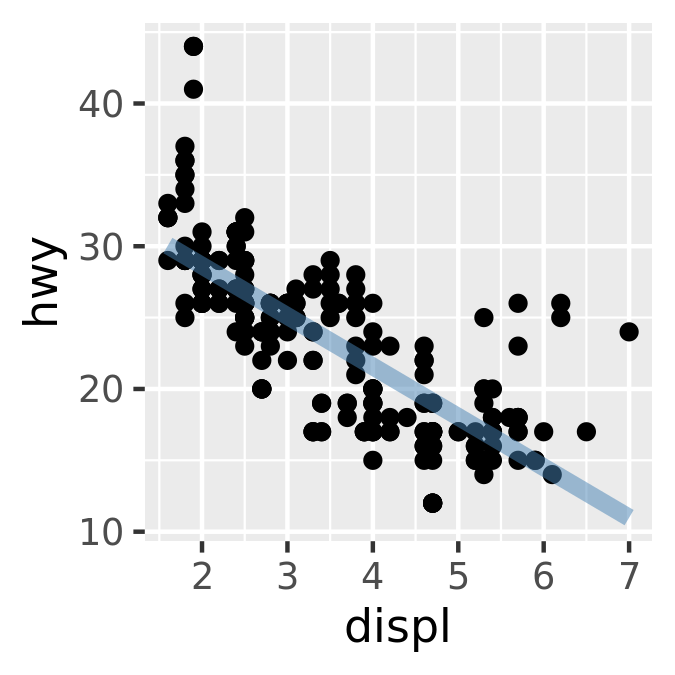
ggplot(mpg, aes(displ, hwy)) +
geom_point() +
bestfit
#> `geom_smooth()` using formula 'y ~ x'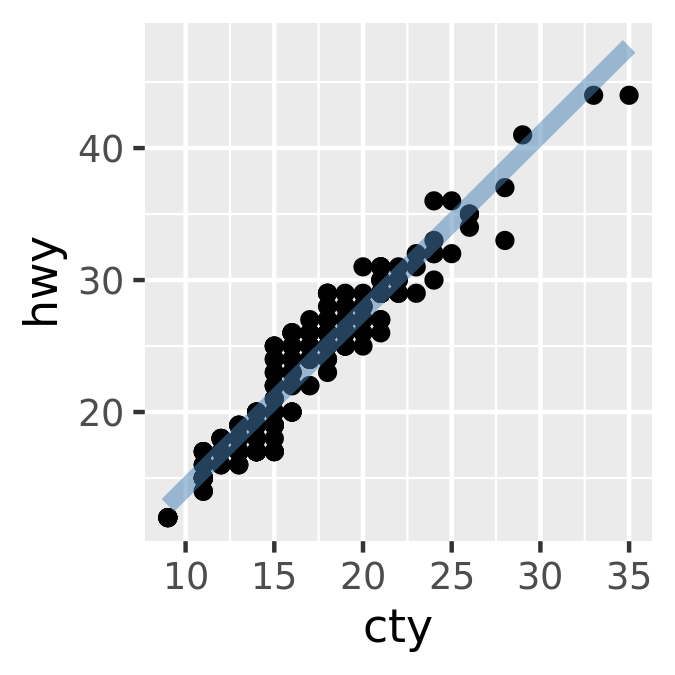
That’s a great way to reduce simple types of duplication (it’s much better than copying-and-pasting!), but requires that the component be exactly the same each time. If you need more flexibility, you can wrap these reusable snippets in a function. For example, we could extend our bestfit object to a more general function for adding lines of best fit to a plot. The following code creates a geom_lm() with three parameters: the model formula, the line colour and the line size:
geom_lm <- function(formula = y ~ x, colour = alpha("steelblue", 0.5),
size = 2, ...) {
geom_smooth(formula = formula, se = FALSE, method = "lm", colour = colour,
size = size, ...)
}
ggplot(mpg, aes(displ, 1 / hwy)) +
geom_point() +
geom_lm()
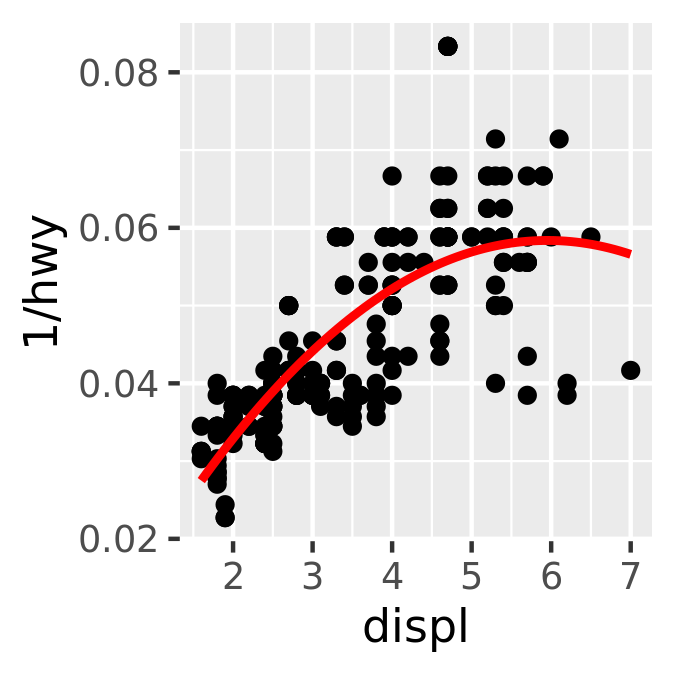
ggplot(mpg, aes(displ, 1 / hwy)) +
geom_point() +
geom_lm(y ~ poly(x, 2), size = 1, colour = "red")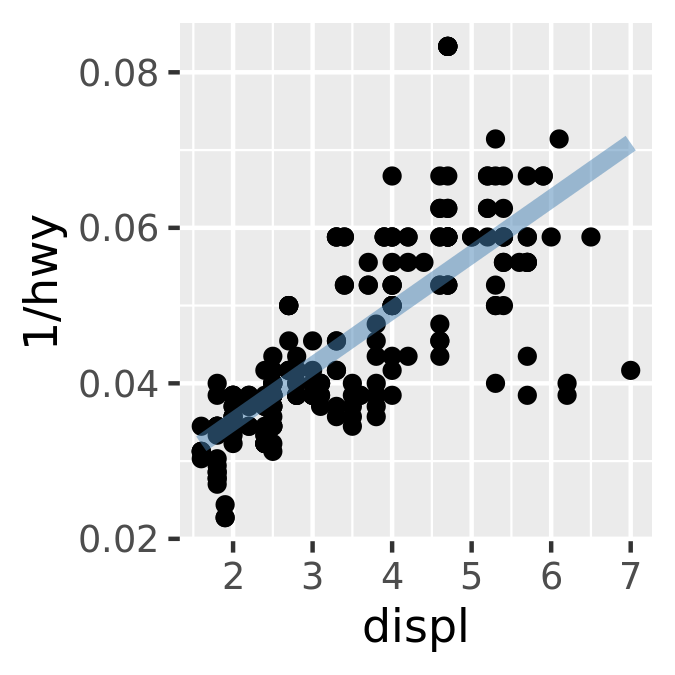
Pay close attention to the use of “...”. When included in the function definition “...” allows a function to accept arbitrary additional arguments. Inside the function, you can then use “...” to pass those arguments on to another function. Here we pass “...” onto geom_smooth() so the user can still modify all the other arguments we haven’t explicitly overridden. When you write your own component functions, it’s a good idea to always use “...” in this way.
Finally, note that you can only add components to a plot; you can’t modify or remove existing objects.
18.2.1 Exercises
Create an object that represents a pink histogram with 100 bins.
Create an object that represents a fill scale with the Blues ColorBrewer palette.
Read the source code for
theme_grey(). What are its arguments? How does it work?Create
scale_colour_wesanderson(). It should have a parameter to pick the palette from the wesanderson package, and create either a continuous or discrete scale.