21.1 What is a spring?
Developing an extension usually starts with idea of what to draw. In this case, we want to draw a spring between two points. To begin, we’ll need to consider how to draw a spring. There are probably many ways, but one simple approach is to draw a circle while moving the “pen” in one direction:
circle <- tibble(
  x = sin(seq(0, 2 * pi, length.out = 100)),
  y = cos(seq(0, 2 * pi, length.out = 100)),
  index = 1:100,
  type = "circle"
)
spring <- circle
spring$x <- spring$x + seq(0, 1.5, length.out = 100)
spring$type <- "spring"
ggplot(rbind(circle, spring)) +
  geom_path(
    aes(x = x, y = y, group = type, alpha = index),
    show.legend = FALSE
  ) +
  facet_wrap(~ type, scales = "free_x")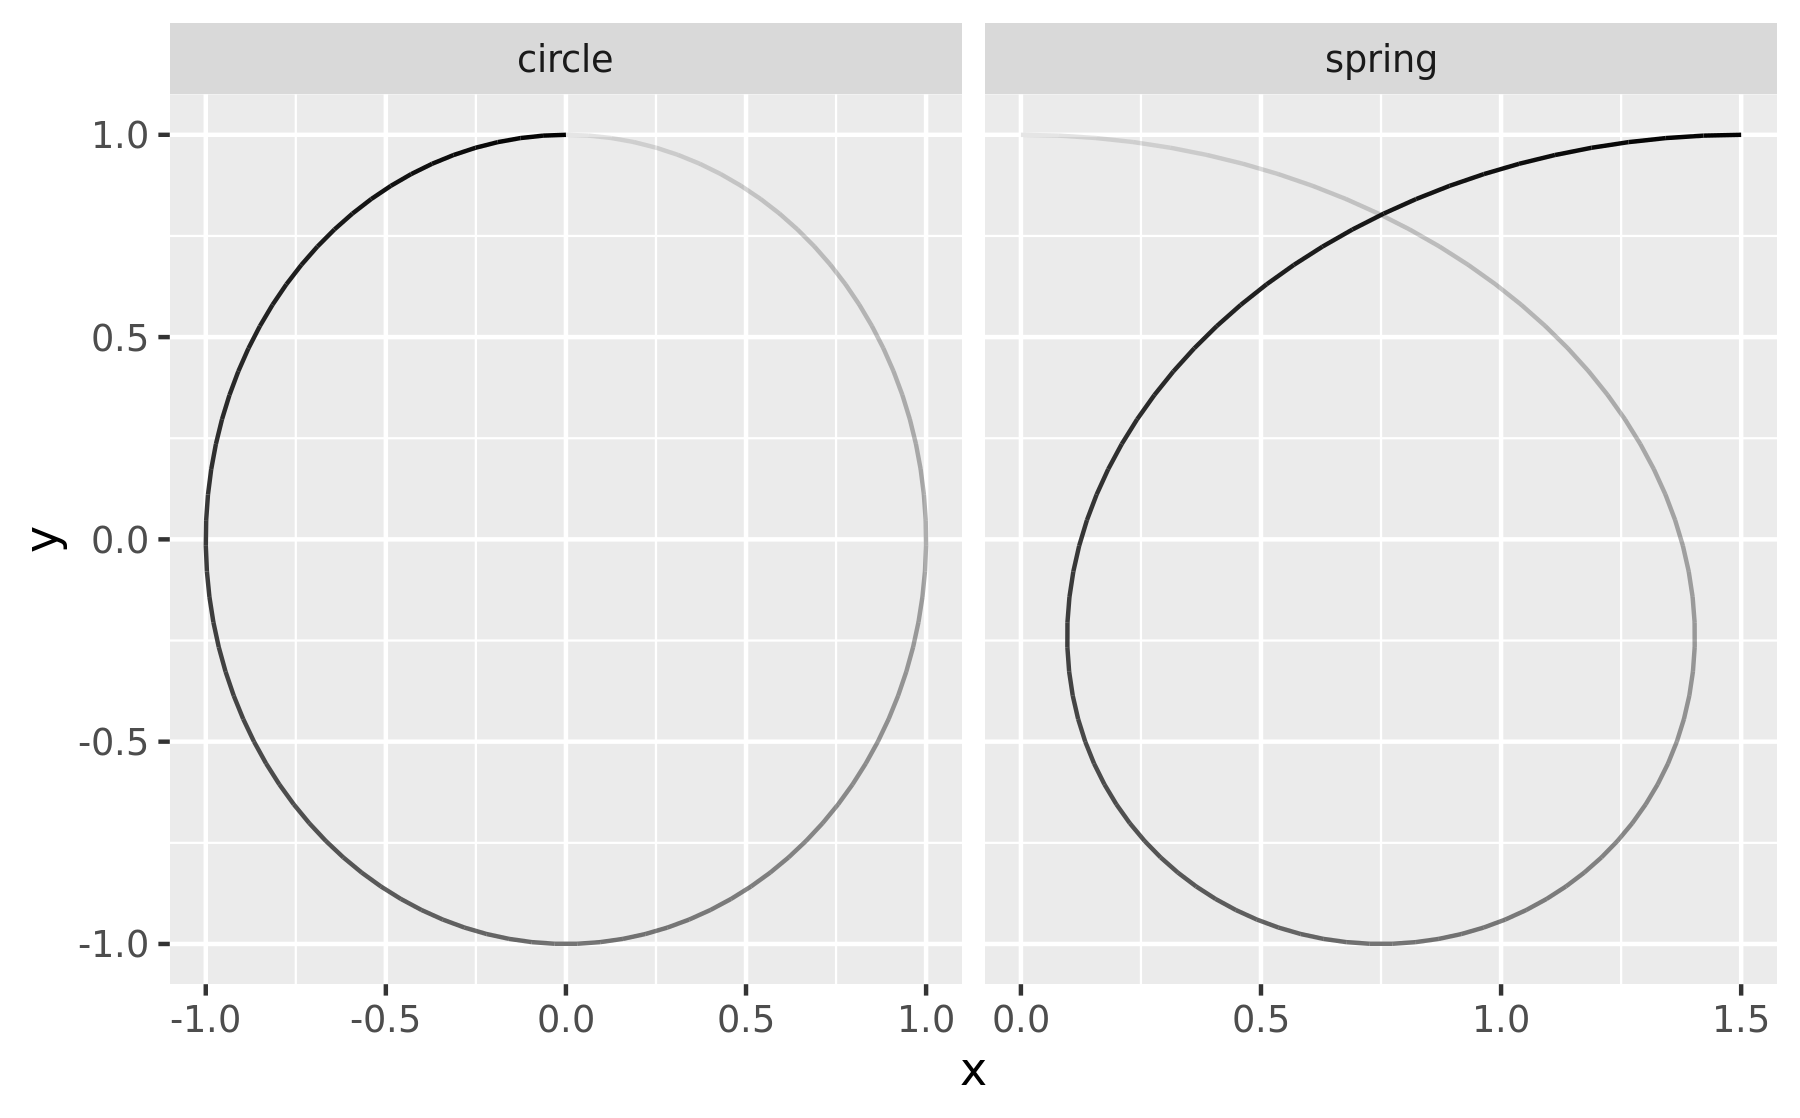
It is clear that simply continuing to trace the circle while moving along x will make the spring longer, and that the speed of the x-movement will controls how tightly spiralled the spring is. This gives us two parameters for our spring:
The
diameterof the circle.The
tension, how fast we move along x.
While I’m pretty sure this is not a physically correct parameterisation of a spring, it is good enough for us.
At this point, it’s worthwhile to spend a little time thinking about how we might turn this into a geom. How will we specify the diameter? How do we keep the circles circular even as we change the aspect ratio of the plot? Can we map diameter and tension to variables in the data? Are they scaled aesthetic? Or they both simple values that must be the same for all springs in a layer?